How Much Creative Analytics Software for Meta Ads Does Your Team Need?


TL;DR
We help Meta teams choose creative analytics depth based on their testing volume, workflow capacity, attribution quality, and the value they can realistically create. Start with reliable grouping and weekly decisions, add automation when manual analysis slows action, and use a cost-to-media calculation before paying for capabilities your team cannot use.
How Much Creative Analytics Software for Meta Ads Does Your Team Need?
Social-media advertising revenue reached $117.7 billion in 2025, up 32.6% year over year. As creative volume rises, the expensive mistake is not having too little data. It is buying more analytics than the team can turn into better ads.
The right creative analytics software for Meta ads depends on how many creatives you test, which channels you run, and whether you need reporting, element-level analysis, or test recommendations. Lean teams should prioritize reliable grouping and fatigue alerts, while larger programs may need automated tagging, attribution context, cross-channel normalization, and governed reporting.
This guide separates those jobs, maps them to team maturity, and shows how to judge whether a tool can repay its cost.
What Does Creative Analytics Software for Meta Ads Actually Do?
Creative analytics connects attributes inside an ad to performance outcomes. Instead of stopping at “this ad had a lower CPA,” it helps a team compare concepts, hooks, offers, formats, creators, visuals, and calls to action across repeated tests.
That makes it different from reporting. Reporting shows what happened by campaign, ad set, or ad. Analytics makes creative patterns easier to inspect. Attribution assigns conversion credit under a stated model. Asset-generation tools create more options. Market research can surface observable messaging and formats. Each can be useful, but none automatically tells a team what should go into next week’s brief.
Publicly observable ads are useful for hypotheses, not proof. We treat market activity as context, then use authorized account results to judge our own decisions.
The practical question is simple: does the tool help the team make a clearer decision before production and media spend? If it only adds another dashboard, it may be reporting software, not a useful decision layer. For a deeper distinction between public signals and account outcomes, see own ad signals.
How Much Analytics Can Your Meta Team Actually Use?
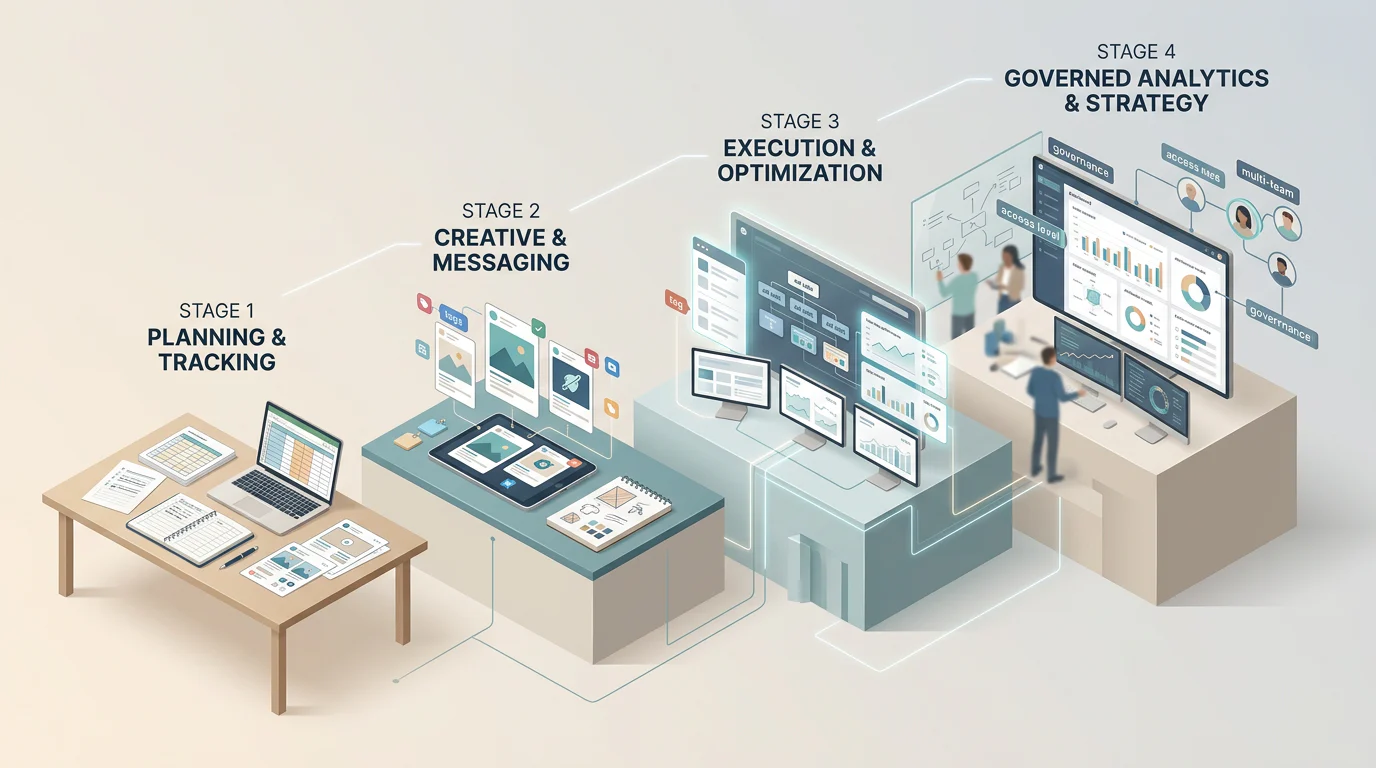
A team should buy the minimum level of analysis that improves its weekly creative decision. The first constraint is rarely a missing AI score. It is usually inconsistent naming, too many simultaneous variables, or no one accountable for turning an insight into a new brief.
| Maturity Level | Team Reality | Capability To Use Now | Capability To Delay |
|---|---|---|---|
| Manual Baseline | One channel, inconsistent names, no recurring review | Native reporting, naming template, weekly export | Automated tagging, prediction, data warehouse work |
| Managed Testing | Repeatable naming and a weekly owner | Grouping, trend views, fatigue flags, shareable reporting | Heavy cross-channel normalization |
| Pattern Learning | Many active tests and collaborative review | Automated tags, hook and concept analysis, test memory | Broad governance infrastructure |
| Governed Scale | Multiple brands, channels, markets, or analysts | Custom taxonomy, permissioning, normalization, data checks | Generic recommendations without accountable owners |
Start with a Decision Owner
A lean team can learn a great deal from consistent ad names and one scheduled review. The owner should be able to choose a control, approve a brief, refresh a live asset, or stop a weak test. Without that person, better analysis simply makes inactivity more legible.
Add Tagging When Manual Grouping Delays Action
Automated tags become useful when ad volume makes manual grouping slow or inconsistent. They should support a visible taxonomy, such as concept, hook, offer, format, creator, visual treatment, and test ID. A label that cannot be checked is not reliable evidence.
Add Recommendations When You Have Memory
Recommendations become valuable when a team has historical tests, a defined success metric, and enough production capacity to act. The useful output is not “make more video.” It is a proposed controlled change, the evidence behind it, the owner, and the decision date.
Add Governance When Complexity Is Real
Cross-channel normalization and custom data work fit teams with multiple brands, markets, or analysts who need the same definitions. They are not a prerequisite for a focused Meta team running a disciplined weekly test process. Teams should also choose a clear test control before comparing creative changes, because changing audience, offer, optimization event, and landing page at once obscures the reason for a result.
Which Tool Category Fits Your Spend and Workflow?
Choose a category for the decision currently blocked in your workflow, not for the longest feature list. A reporting need, a tagging need, an attribution need, and a next-test need are related, but they are not interchangeable.
| Tool Category | Data Inputs | Tagging Depth | Fatigue Detection | Attribution Context | Recommendation Quality | Channel Coverage | Public Monthly Price |
|---|---|---|---|---|---|---|---|
| Native Reporting And Spreadsheet | Low | Manual | Manual | Platform-reported | None | Meta | No separate subscription published |
| Creative Reporting Layer | Medium | Manual To Structured | Trend-Led | Limited | Low | One To Several | Confirm on current pricing page |
| Automated Element Analytics | Medium To High | High | Alert Or Trend-Led | Limited To Medium | Medium | One To Several | Confirm on current pricing page |
| Meta Decision Intelligence | High | High | Evidence-Led | Account-performance context | High when tied to a brief | Meta | Tailored quote |
| Governed Cross-Channel Analytics | High | Custom | Configurable | High when joined to source-of-truth outcomes | Usually analyst-led | Multi-channel | Tailored contract |
The price field deserves unusual care. A visible subscription number does not show implementation time, account limits, tagging workload, or whether the recommended workflow fits a single brand. When terms are not public, “tailored quote” is more honest than a guessed monthly cost.
| Route | Public Monthly-Price Field | Public Account-Limit Field | Supported-Channel Field | Team Workload |
|---|---|---|---|---|
| Native Meta Workflow | No separate subscription published | No public plan limit stated | Meta | Naming, export, manual grouping |
| Deepsolv | Tailored quote | No public numeric limit stated | Meta growth workflow | Weekly plan review and execution |
| Other Paid Categories | Use the provider’s current public term | Use the provider’s stated allowance | Use the provider’s stated coverage | Record setup, tagging, and review hours |
If your team needs a simple operating comparison before a demo, use this creative testing workflow to identify whether reporting, analysis, or test prioritization is the actual bottleneck.
Which Metrics Belong at Each Creative Level?
A clean analytics setup does not put every metric on every creative label. It gives each layer the measures needed to answer its own question, while preserving the conditions that made the comparison fair.
Ad-Level Metrics Show Delivery and Economics
At ad level, track spend, impressions, reach, frequency, CPM, CTR, CPC, landing-page views, conversion volume, CPA, and platform-reported ROAS where relevant. Compare only ads with compatible dates, audiences, optimization events, placements, and attribution settings.
Concept-Level Metrics Show Repeatability
A concept is the recurring promise or angle behind several executions. Assess its spend-weighted CPA or ROAS, conversion rate, test count, win rate, and time to decision. One strong ad may be a useful lead, but it is not a proven concept.
Hook-Level Metrics Show Attention Quality
Hooks need attention and click-quality signals, such as early video retention, view signals, CTR, landing-page-view rate, and downstream conversion quality. These are diagnostic measures, not evidence that a hook caused a purchase. Our guide to hook signals explains why a strong early signal can still lead to weak buying intent.
When Can You Trust a Fatigue or Attribution Signal?
Treat fatigue as a pattern to investigate, not a universal frequency threshold. A reliable diagnosis considers rising exposure alongside declining attention, weakening conversion quality, delivery changes, audience conditions, offer changes, and landing-page performance.
An ad’s decline may be fatigue, but it may also be a delivery shift, seasonal demand, audience saturation, or a weaker offer.
Attribution has a similar boundary. It is necessary context for creative analysis because it tells the team how a conversion was credited. It does not prove that a creative element created incremental demand. When a fatigue signal appears, document the evidence, hold a control where possible, and choose whether to refresh, re-angle, pause, or keep learning. Use a consistent fatigue response that records the audience condition, the delivery change, the comparison window, and the next creative decision.
A useful review also separates a weak execution from a weak idea. If the hook loses attention while landing-page conversion stays stable, refresh the opening. If attention holds but conversion quality deteriorates, inspect offer, audience, and landing-page alignment before blaming the creative. If the same concept repeatedly fails under fair conditions, record that outcome so future briefs do not treat the idea as new evidence.
Finally, apply explicit stop rules before results make the decision emotionally difficult. The rule should name the metric, time window, comparison condition, owner, and action that follows.
Why Deepsolv Fits a Weekly Meta Test Workflow
At Deepsolv, we help Meta growth teams turn scattered creative signals into a ranked weekly test plan. We combine authorized account performance, permitted customer evidence, observable market activity, and past experiment learnings so the next brief has a reason, an owner, and a defined decision rule. Our role is not to replace a media buyer’s judgment, generate endless assets, or claim that a public ad proves revenue. We help teams decide which concept merits production, which live creative needs a refresh, and which repeated idea should stop consuming attention.
Bring a recent account review, current naming conventions, and the next decision your team cannot settle. We will walk through the evidence trail, the level of analysis your workflow can use, and the actions it can support. Then we will show how our weekly plan connects those signals to accountable action across the team.
FAQs on Creative Analytics Software for Meta Ads
Creative analytics is most useful when it shortens the path from performance evidence to a specific creative decision. These answers clarify where a lean team should start and where stronger measurement is necessary.
What Should Lean Meta Teams Use Before Making New Ads?
Lean Meta teams should begin with consistent naming, reliable creative grouping, and one weekly decision owner. Add automation only when manual analysis delays production choices.
Can Creative Analytics Software Find Creative Fatigue?
A tool can flag a pattern consistent with fatigue, but cannot diagnose it alone. Check rising exposure, declining attention, conversion quality, offer changes, and delivery conditions.
Does Element-Level Analysis Prove Causation?
No. Element-level analysis reveals useful correlations, especially when an account groups repeated creative attributes. Causal conclusions require controlled tests, stable conditions, adequate volume, and appropriate attribution context.
When Is Creative Analytics Software Under $500 a Month Worth It?
It is worth considering when its subscription and operating time can plausibly save more than they cost, and your team can use findings in weekly creative decisions.
What Is the Difference Between Creative Analytics and Attribution?
Attribution assigns conversion credit under defined rules. Creative analytics examines patterns in assets and outcomes. Neither proves incremental impact without a controlled experiment or lift measurement.