
Glossary
Static vs Video Ads
Static vs video ads has no universal winner on Meta. Choose the next format to test by comparing your own cost per purchase by format with the formats competitors are actively running.

By Sachit Sharma, CEO & Founder · Updated 24 Oct 2026
On this page
- 01Definition
- 02Quick facts
- 03Do static or video ads win on Meta?
- 04Why does an average across accounts mislead you?
- 05How do you compare your format results with competitor formats?
- 06Turning the gap into a test
- 07What can the Meta Ad Library tell you about competitor formats?
- 08How Deepsolv handles it
- 09Example
- 10Related terms
- 11Frequently asked
Should you test static or video ads on Meta next?
A static ad is a single image or a carousel, a swipeable set of images in one ad. A video ad is anything that moves: user-generated content (UGC, ads made in a creator's style), motion graphics or animated clips.
Key takeaways
- One agency's 2026 study of 17 US accounts found that the format cheaper per thousand impressions was not the one with more clicks, so an average hides differences between accounts. It is one agency's self-reported data, not an established benchmark.
- The Ad Library shows which ads competitors run, not what they earn. Treat a competitor's format mix as a hypothesis to test.
- Test one format change at a time: same angle (the main reason to buy that the ad leads with, such as price, speed or social proof), same audience, same budget.
Quick facts
- Judge a format by
- Cost per purchase over a period with enough purchases, not CTR or one standout ad
- Too thin to read
- Fewer than about 30 purchases in a format (a rule of thumb)
- About the same
- Cost-per-purchase indexes between 0.90 and 1.10 (a rule of thumb)
- Competitor source
- Meta Ad Library, filtered by media type (image, video)
Static vs video ads is usually argued as a contest, but the useful question on Meta is narrower: which format should your next test use? Every test costs budget and a creative slot, and a test aimed at the wrong format spends both while telling you little you did not already know, so the budget buys a result that changes no decision.
An average across many accounts cannot answer the question for yours. Your own cost per purchase by format, set beside the formats your direct competitors are actively running, can. That comparison takes one table and about an hour, and a worked example on this page shows the arithmetic. It has one limit: the competitor half shows activity, not results.
Do static or video ads win on Meta?
Neither wins across the board. In one agency's self-reported study of 848 high-spending Meta ads from 17 US accounts (June to August 2026, $14.9 million combined spend), video took 68% of spend and statics 32%. In the median of the 12 accounts where both formats drove at least 20 purchases, statics' cost per purchase was within 4% of video's.
The study counted statics as images and carousels, and video as UGC, motion and animated ads. It is one agency's data, one season, and only each account's top 50 ads, so read it as an illustration, not a rule.
Why does an average across accounts mislead you?
An average hides the accounts that went the other way. In the same study, statics had the lower cost per 1,000 impressions (CPM, 15% lower) in 13 of 17 accounts, while video had the higher click-through rate (CTR, the share of viewers who click) in 13 of 17. Statics' cost per click was 8% higher. That leaves four accounts on each metric where the pattern reversed.
So one static beating one video in your account proves little. Your result may be real, but it could also reflect the angle, the offer or the week. Judge a format by cost per purchase over a period with enough purchases, not by CTR or one standout ad. For video, check hook rate first, because a weak opening can sink a good video.
How do you compare your format results with competitor formats?
Build a four-step table. This is a recommended method, not an industry standard.
Your results beside competitor activity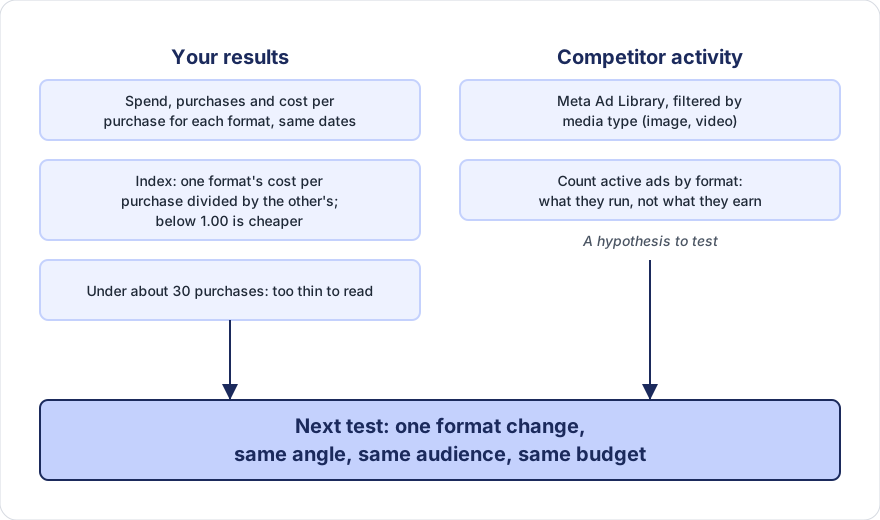
- Your results. For each format (static image, carousel, UGC video, motion or demo video), record spend, purchases and cost per purchase over the same dates and objective. Divide each format's cost per purchase by the other format's to get an index; an index below 1.00 means that format is cheaper.
- Your confidence. Mark any format with fewer than about 30 purchases as "too thin to read." That threshold is a rule of thumb, not a sourced figure.
- Competitor activity. In the Meta Ad Library, search three to five direct competitors and filter by media type (image, video). Count their active ads per format and write down the date.
- The gap. Compare your format mix with theirs and apply the decision table below.
Turning the gap into a test
Once the table is filled in, match what you see to a row below. Write the test as one line: "Static vs UGC video, same angle, same audience, same budget." For help with the testing itself, see how to analyze Facebook ads and choose your next test and creative iteration. If the format you are weighing is creator-led, the UGC ads guide covers cost and testing.
- What you see
- Your format is cheaper per purchase and rivals under-use it
- Next test (recommended)
- More of it, on a new angle. Rivals' gap may be an opening or something they tried and dropped; the test tells you.
- What you see
- Your cheaper format is also the one rivals use most
- Next test (recommended)
- Test a new angle in that format, not a new format
- What you see
- Rivals lean on a format you rarely run, and you have under about 30 purchases in it
- Next test (recommended)
- One small test of that format using your best-proven angle
- What you see
- Indexes between 0.90 and 1.10 (a rule of thumb for "about the same")
- Next test (recommended)
- Decide on production speed and cost, and test the angle, not the format
- What you see
- Your main format costs more per purchase and rivals run it heavily
- Next test (recommended)
- Fix the creative before adding volume
What can the Meta Ad Library tell you about competitor formats?
It tells you what competitors are running and in which format, but not how well it works. The Ad Library lets you search ads that are currently active, and its research tools support filtering by media type. Meta shows spend and reach for ads about social issues, elections or politics. For ordinary commercial ads, you get the creative and delivery information, not results.
A rival's long-running video may be profitable, or no one may have switched it off. Count ads for direction, then verify with your own test. The limits are explained in Meta Ad Library Shows Ads, Not Competitor Results.
How Deepsolv handles it
We do this cross-reading as a weekly routine. Our creative intelligence platform for Meta advertising teams tracks competitor ads, including their formats, hooks and offers, and reads them against your ad-performance data and past ad learnings. The output is a ranked weekly test plan and execution-ready creative briefs, so the format question becomes a specific test with a brief behind it.
To set how many tests your team can run, use our creative test capacity planner. More guides are in our Insights.
Example
Illustrative example (invented numbers, to show the arithmetic): your static ads have $6,000 spend and 120 purchases, so $50.00 per purchase, while your video ads have $14,000 and 250 purchases, so $56.00. The static index is 50 ÷ 56 = 0.89, about 11% cheaper, with statics at 30% of the $20,000 total spend. Three rivals have 200 active ads, 30 image and 170 video (15% image), so your cheaper format is the one rivals use least. The first row of the decision table applies: test more statics on a new angle.
Frequently asked
Sources
- 1.Static vs. Video Ads on Meta: Data From $14.9M in Ad Spend, Biddyco, 2026
- 2.What is the Meta Ad Library and how do I search it?, Meta
- 3.Meta Ad Library tools, Meta