
How to Spot Ad Fatigue Before CPA Rises: An Ad Fatigue Detection Framework


TL;DR
At Deepsolv, we treat ad fatigue detection as a baseline-driven diagnosis, not a universal frequency rule. We compare attention, clicks, exposure, delivery changes, and later conversion efficiency across Meta and TikTok, then help teams managing large variant portfolios choose whether to refresh execution, replace an angle, change distribution, or stop a test.
Paid-social performance gets noisy when delivery changes, which is why a single bad day rarely explains a creative problem. TikTok identifies 50 conversions as a significant learning-phase milestone, a useful reminder that early CPA data can be unstable.
Effective ad fatigue detection compares each creative with its own stabilized baseline, flags sustained drops in attention or click response alongside rising exposure, and checks delivery changes before acting. CPA and ROAS confirm the impact later, so teams should use them to escalate a diagnosis, not to discover one.
Below, we show how to read those signals across Meta and TikTok, monitor 40 or more variants in one portfolio view, and choose the smallest justified response.
What Signals Should Flag Ad Fatigue Before CPA Rises?
Good monitoring starts with a pattern, not a magic CTR, frequency, or spend threshold. A creative can have a lower absolute CTR than another and still be healthy if it is holding its own baseline. Conversely, a formerly strong variant can be in decline while still posting an account-average result.
Which Leading Signals Move First?
Attention and click response are the earliest useful signals because they sit closest to the creative itself. On TikTok, the available video metrics include two-second and six-second views, quartile views, and average play time. On Meta, use the most comparable view and link-click measures available for the objective and placement.
A declining hook or hold signal says people are becoming less willing to stay with the asset. A declining link CTR says the message is losing its ability to earn the next action. Neither proves fatigue alone, but both deserve attention before conversion metrics catch up. Our angle tracking approach keeps that comparison tied to the creative’s message, not just its ad ID.
Which Signals Confirm the Pattern?
Frequency, reach rate, spend share, CPM, and placement mix add delivery context. Rising exposure alongside declining attention is more concerning than declining attention with stable exposure. A creative losing spend share while similar variants retain it may indicate that the platform is finding weaker response from that asset.
CPA, cost per purchase, and ROAS are confirming signals. They tell us the business consequence has arrived, but they rarely tell us whether the cause was repetition, a new placement mix, a narrower audience, a weaker offer, or an on-site problem.
Which Signals Should Not Trigger an Alert?
One weak reporting window is noise until the data says otherwise. Exclude launch volatility, major campaign edits, placement reallocations, unusual spend changes, and learning periods from the comparison set. The purpose is not to make every dashboard cell red. It is to identify the few variants that warrant human attention.
Why Are CPA and ROAS Lagging Indicators in Ad Fatigue Detection?
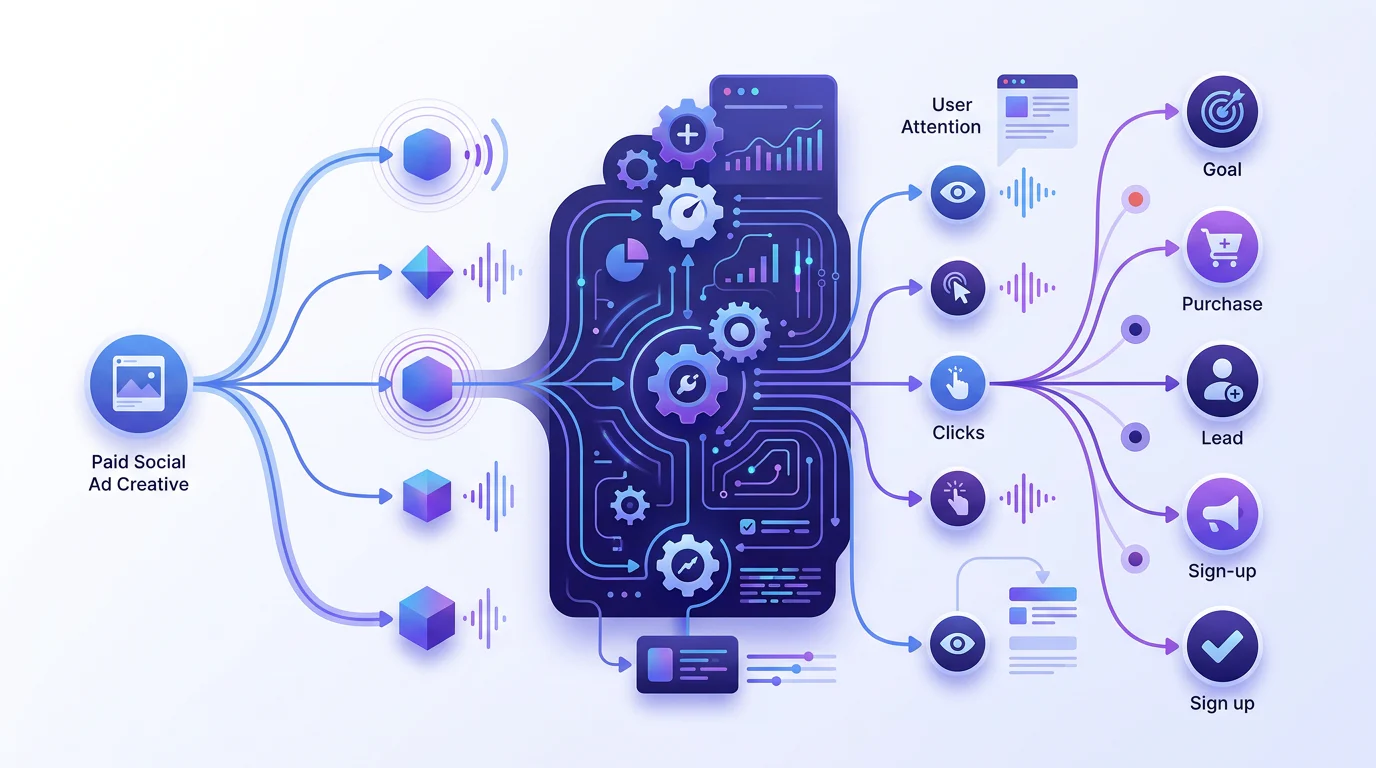
CPA and ROAS sit at the end of a chain: an impression must earn attention, then a click, then an on-site action, then an attributed conversion or revenue event. By the time those final metrics move, the creative may already have lost attention from the audience that once responded to it.
Meta notes that performance is less stable and CPA is usually worse during the learning period. That is why we do not compare a fresh variant with a mature one as though both had equal delivery conditions. We establish a baseline only after the creative has enough stable, comparable delivery to make the contrast meaningful.
A lagging result can still be valuable. If attention, click response, exposure, and conversion efficiency all weaken in sequence, the case is stronger. If CTR holds while conversion rate drops, look downstream first: the landing page, offer, product availability, tracking, or checkout may be the real issue. Capturing that distinction in test memory prevents teams from calling every performance decline a creative failure.
Is It Creative Fatigue, Audience Saturation, or Delivery Volatility?
The most expensive mistake is treating every decline as the same problem. Creative fatigue means the execution or message is losing response. Audience saturation means delivery is revisiting a constrained pool too often. Delivery volatility means the comparison itself has changed.
Use this decision tree before changing a creative:
-
Delivery Change Detected: Check learning status, audience, placements, optimization event, bid, budget, and schedule. Rebuild the comparison if a meaningful condition changed.
-
Stable Delivery With Attention Decay: Compare the same creative across like-for-like audiences and placements. Sustained decay with rising exposure is a fatigue candidate.
-
Fresh Creative Holds Better In The Same Audience: Treat the issue as execution or angle decline, rather than simply blaming the audience.
-
CTR Holds But Conversion Rate Falls: Investigate the post-click journey and measurement before replacing a creative.
TikTok advises limiting budget adjustments and avoiding frequent changes because they can disrupt optimization, as its budget guidance explains. That is practical diagnostic advice, not a reason to wait passively when a genuine decline is building.
Audience saturation is usually local. A creative may continue to work for one audience or placement while losing response in another. Creative fatigue is more plausible when the same pattern appears across stable delivery cells. For a deeper distinction between the two, use our fatigue diagnosis guide.
Which Meta and TikTok Metrics Should Teams Track Differently?
The platforms share the same diagnostic goal, but they expose different attention signals. We do not force a Meta view metric to mean exactly what a TikTok view metric means. We compare each platform’s metrics to that platform’s own stabilized creative baseline.
Meta defines ThruPlay as a completed view for videos shorter than 15 seconds, or at least 15 seconds for longer videos, while its awareness objective also supports two-second continuous views. Those video-view options make useful attention proxies when matched to the objective.
| Monitoring Need | Meta | TikTok | Interpretation |
|---|---|---|---|
| Attention Signal | Two-second continuous views and ThruPlay | Two-second and six-second views, quartiles, average play time | Compare against the creative’s platform-specific baseline |
| Click Response | Link CTR or comparable click metric | CTR or comparable click metric | Use the same click definition within each platform |
| Exposure Context | Frequency, reach, placement mix | Frequency, reach, placement mix | Read exposure with attention, never by itself |
| Learning Context | Learning and learning-limited status | Learning phase and conversion volume | Exclude unstable windows from the baseline |
| Business Confirmation | CPA, purchases, ROAS | CPA, purchases, ROAS | Use to confirm impact and prioritize action |
This cross-platform discipline matters when a team sees a strong launch followed by a sharp decline. The answer is rarely “TikTok fatigues faster” or “Meta has a safe frequency.” It is whether the relevant attention signal has decayed under comparable delivery conditions. Our Meta and TikTok guide helps teams keep those comparisons separate without losing the portfolio view.
How Can Teams Monitor 40 or More Variants Without Manual Checks?
At 40 or more active variants, checking Ads Manager every morning becomes a detection system built on memory and luck. We recommend one portfolio table that ranks variants by change, not just by today’s CPA. That makes stable winners quiet and puts likely problems at the top.
Each row should preserve the context behind its numbers. Without angle, audience, placement, learning status, and recent change history, a dashboard can tell a team what fell but not why.
What Should a Fatigue Dashboard Include?
| Field | Why It Matters | Alert Use |
|---|---|---|
| Creative, Angle, And Format | Separates a weak execution from a weakening message | Groups related variants for diagnosis |
| Baseline Delta | Shows change from the creative’s own stabilized performance | Primary ranking signal |
| Frequency And Reach | Adds exposure pressure and audience context | Confirms or weakens the fatigue case |
| Spend And Spend Share | Shows delivery priority and portfolio risk | Identifies high-cost declines |
| Sample Sufficiency | Prevents action on thin data | Gates alerts until the configured floor is met |
| Learning And Change Status | Records recent delivery confounds | Suppresses misleading comparisons |
| Alert Status | Distinguishes watch, review, confirm, and action | Creates an operating queue |
What Alert Logic Is Defensible?
Use relative baselines and configurable minimum data requirements. Establish the baseline from comparable, post-learning windows. Require sufficient impressions or clicks for the account’s normal CTR and conversion volume, then require the decline to persist across consecutive nonoverlapping observation windows.
An alert should move from watch to review when attention or click response weakens versus baseline. It should move to confirmed only when exposure, spend, and delivery context support the pattern and the change log offers no better explanation. This is how we turn cross-platform signals into decisions instead of notifications.
How Should Category Movement Influence the Read?
Competitor activity is context, not proof. Meta’s public Ad Library shows currently active ads, which can reveal launch cadence, repeated claims, and format repetition, but it does not reveal another advertiser’s actual conversion performance.
TikTok’s Top Ads resources can add category context because they support filtering by industry, region, time range, and performance signals such as CTR and six-second view rate. Use those Top Ads insights to decide what to investigate or test next, not to declare a creative exhausted. We keep that external context attached to first-party performance evidence.
What Should Happen After a Confirmed Alert?
| Diagnosis | Response | Preserve | Next Test |
|---|---|---|---|
| Execution Is Tiring, Angle Still Works | Refresh an execution | Core message and offer | Hook, opening frame, creator, pacing, or format |
| Multiple Executions Of One Message Decay | Replace the angle | Stable audience and offer | New problem, proof, objection, or use case |
| Creative Works In Some Cells Only | Change distribution | Winning execution | Audience, placement, or delivery mix |
| No Stable Evidence Of Recovery | Stop the test | The decision record | A genuinely different hypothesis |
The best response is the smallest one supported by the evidence. A new thumbnail may be enough when the angle still converts. A new audience may help when fatigue is isolated. A new angle is warranted only when repeated executions fail under stable delivery. Stopping a test is not lost work when the team records why it stopped. Our competitor tracking workflow preserves that context for the next review.
How Can Deepsolv Help You Act Before CPA Rises?
At Deepsolv, we built our workflow for teams that need to see the pattern before reporting shows the consequence. Our platform brings creative performance, concept tags, delivery context, and market movement into one working view so we can surface decisions rather than another dashboard. We help teams preserve the evidence behind a winning angle, distinguish it from delivery noise, and hand the next test to the people who make it. That means fewer vague refresh requests and clearer choices about whether to change the execution, replace the angle, redirect distribution, or end the test, including the audience, placement, spend, and learning-state changes that can make one metric look more conclusive than it is. If you are managing a large paid-social portfolio, we can help you turn alert logic into a repeatable weekly operating system while keeping the context behind every call. Start with Book a demo.
FAQs on Ad Fatigue Detection
How Do You Detect Ad Fatigue Before CPA Rises?
Compare each creative's attention and click metrics against its stabilized baseline, verify exposure and delivery conditions, then require sustained decline before using CPA deterioration as confirmation.
Which Meta Ad Fatigue Early Warning Metrics Matter Most?
Use link CTR, video attention where available, frequency, reach, spend share, CPM, and learning status across comparable audiences and placements. Read the combined trend, never one threshold.
How Should TikTok Creative Fatigue Monitoring Work?
Track two-second and six-second view behavior with CTR, frequency, conversion efficiency, and learning status. Compare equivalent windows only after delivery stabilizes, then act on sustained decay.
What Tools Help Monitor CTR Decay Across Many Variants?
Use platform reporting as source data, a unified portfolio view for variant baselines and alerts, plus a change log that explains delivery shifts before action.
What Should Happen When an Alert Is Confirmed?
Choose the smallest justified response: refresh execution, replace the angle, change distribution, or stop the test. Record the rationale so subsequent tests start with better evidence.