


TL;DR
We help performance teams consolidate cross-platform campaign signals by preserving raw platform data, mapping it to a governed shared model, and separating comparable KPIs from platform-specific attribution. This guide shows how we structure sources, normalize definitions, retain historical lineage, validate data quality, and turn evidence into owned creative and budget actions.
Disconnected dashboards create more than reporting work. They make performance changes hard to interpret, especially because analytics exports can update daily records for a three-day period after events arrive late.
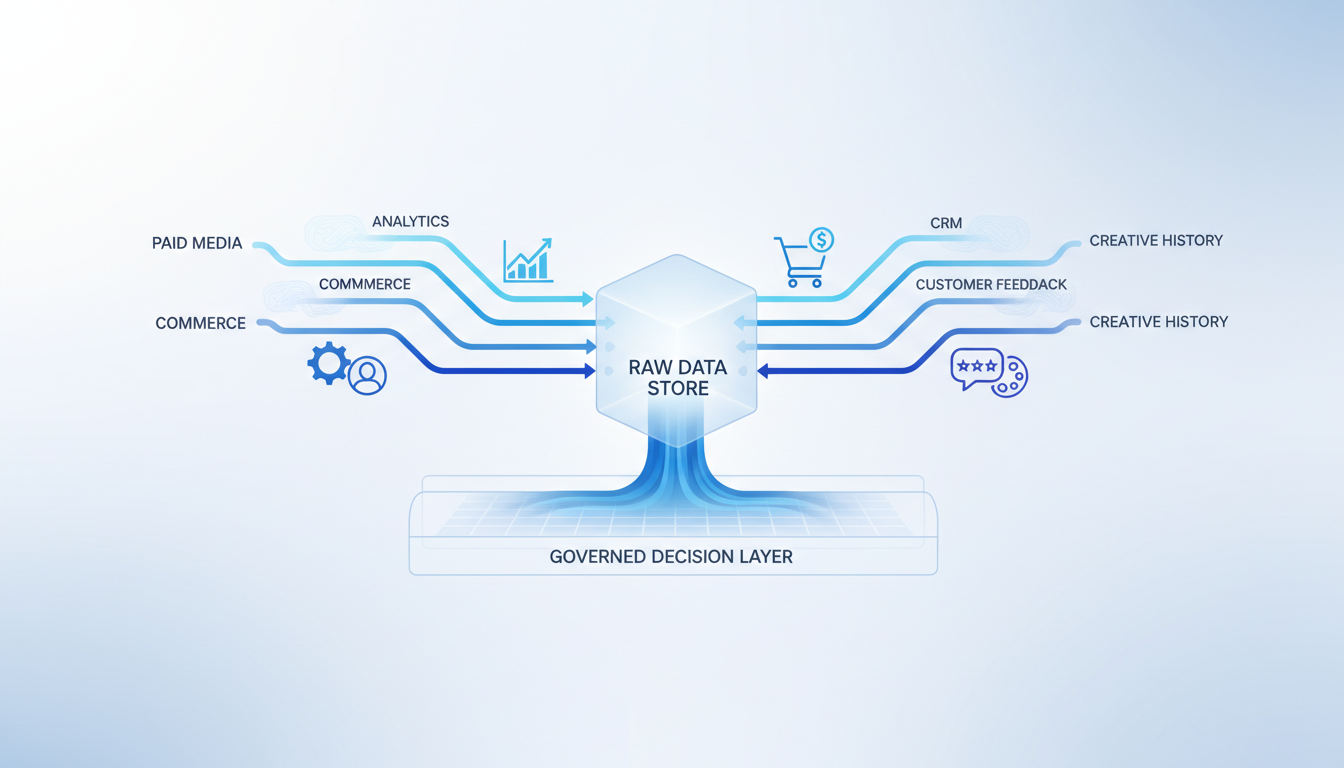
Cross-platform campaign signal consolidation works when you extract every platform into a central store, preserve its raw fields, and map each record to a shared campaign, creative, audience, conversion, and time model. Normalize currencies, time zones, attribution windows, and KPI definitions before comparison, then route validated changes to documented owners and actions.
This guide explains the architecture, shared data model, governance rules, historical-data migration process, and decision workflow we use to make consolidated signals genuinely useful.
What Architecture Should You Use for Cross-Platform Campaign Signal Consolidation?
The right architecture depends on the decision your team needs to make, not on how many dashboards you can combine. A lightweight aggregator can reduce manual exports, a warehouse can support deep modeling, and a creative-intelligence layer can connect performance changes to the ads, feedback, and prior tests behind them.
| Architecture Path | Setup Effort | Engineering Dependency | Historical Backfill | Attribution Control | Customer-Signal Support | Creative Taxonomy | Actionability | Verified Cost |
|---|---|---|---|---|---|---|---|---|
| Native aggregator | Low to medium | Low | Depends on available exports | Limited | Limited | Often manual | Reporting-focused | Not publicly verified here |
| Warehouse plus BI | High | High | Strong when raw exports exist | High | Strong | Custom-built | Depends on team workflow | $6.25 per TiB scanned after the monthly free tier |
| Creative-intelligence layer | Medium | Medium | Strong when history and assets are imported | Preserves source and normalized views | Strong | Structured | Diagnosis and next-test focused | Not publicly verified here |
We recommend retaining a raw layer even when the final interface is simple. That preserves the platform record, lets analysts audit a recommendation, and prevents a normalized dashboard from silently replacing the meaning of the original metric. Our creative intelligence work is built around that distinction.
Which Sources and Fields Belong in a Shared Signal Model?
A useful model starts with source inventory, not a dashboard mockup. We document who owns each source, its reporting grain, its immutable identifiers, its refresh expectation, and the gaps that should prevent certain comparisons.
| Source | Preserve Raw Fields | Primary Join Keys | Decision Use |
|---|---|---|---|
| Meta and Google | Spend, delivery, campaign hierarchy, conversions, attribution settings | Account and platform object IDs | Media performance |
| Analytics | Event names, timestamps, traffic source, sessions | User, session, order, campaign parameters | Journey context |
| Commerce | Orders, refunds, discounts, products, customer status | Order and customer IDs | Revenue truth |
| CRM | Lifecycle stages, qualified leads, sales outcomes | Lead and customer IDs | Lead quality |
| Customer Feedback | Comment, review, survey, support, and message themes | Product, creative, audience, date | Message diagnosis |
| Creative History | Files, copy, launch dates, tags, prior test outcomes | Creative and asset IDs | Creative learning |
The shared hierarchy should include account, campaign, ad set or ad group, ad, creative, audience, conversion, and date. Every normalized record should also keep the original identifier, source system, extraction timestamp, and transformation version. That is how a report remains auditable after naming conventions or campaign structures change.
Customer feedback belongs beside media data because it explains performance that spend and conversion columns cannot. Teams can connect campaign outcomes with angle performance to turn recurring objections or language into testable creative hypotheses.
How Do You Normalize Metrics Without Erasing Platform Meaning?
Normalization should make comparisons possible, not pretend all platforms measure the same thing. We keep source-reported values visible, then create separately labeled comparison fields for business decisions.
Preserve Source Metrics First
Do not overwrite platform conversion totals, attribution settings, or reporting dates. Store the raw measure beside its definition, platform, extraction time, and configuration. This makes it possible to explain why two sources differ without implying one is automatically wrong.
Standardize Time, Currency, and Naming
Convert reporting timestamps to UTC, then publish a chosen business time zone in the decision layer. Convert financial values to a common reporting currency while retaining original currency and the exchange-rate date. Map campaign names to controlled fields such as market, objective, audience, offer, and creative concept.
Time zone and currency changes can alter the reporting context materially. For example, changing both settings in a Meta advertising account creates a new ad account, so historical account identity must remain intact.
A governed metric layer makes it easier to build conversion-ranked intelligence because the source, definition, and limitations stay attached to every comparison.
Treat Attribution Windows as Scenarios
Use separate views for source-reported attribution, standardized comparison, and business-outcome measurement. Do not add platform-attributed conversions together as if each represented a mutually exclusive customer.
Google’s default click-through conversion window is 30 days, while default engaged-view and view-through windows differ. Configuration changes also apply forward, which makes an effective-date ledger essential for historical reporting.
Define Comparable Conversion Events
Create a canonical event dictionary, such as purchase, qualified lead, subscription start, or repeat purchase. Map every source event to one canonical event only when its definition genuinely matches. Otherwise, keep the difference explicit in the KPI glossary.
This structure gives teams a durable way to evaluate creative strategy options without forcing every platform metric into a false equivalence. It also makes performance analysis more reliable because attribution and conversion context stay attached to the evidence.
How Do You Protect Historical Data and Dashboard Logic During Migration?
Migration is a lineage project before it is a software project. The risk is not merely losing rows, it is losing the original definition, filter, date logic, and calculation that made a historical number meaningful.
Archive Raw Exports Before Rebuilding Views
Export campaigns, performance tables, creative files, IDs, dashboard screenshots, custom fields, filters, and calculated metrics. Archive raw historical data separately from summary exports so future analysts can rebuild a view without relying on a flattened report.
Analytics exports are not an unlimited recovery mechanism. Google notes that data cannot simply be re-exported later after an export relationship has been created, so preserve available history before changing the workflow.
Translate Logic into Versioned Definitions
For each dashboard metric, capture the formula, source fields, exclusions, grouping, time basis, attribution basis, owner, and effective date. Translate it into the new model without rewriting history. If the new definition is better, publish it as a new version rather than relabeling prior results.
Reconcile Before Releasing
Compare representative periods by account, date, spend, conversion count, conversion value, creative count, and customer outcome. Investigate material variance before the old view is retired. Label unavoidable gaps and identify which source remains authoritative for each question.
Historical creative should carry its files, text, original IDs, taxonomy, launch date, and past outcomes into the new environment. That creates the continuity required for research to results, rather than treating every new creative review as a fresh start.
How Do Consolidated Signals Become Alerts and Next Actions?
A consolidated dashboard becomes decision infrastructure only when it can tell a team what changed, what evidence supports the diagnosis, and who should act next. We use a five-stage flow:
Raw source data → validated records → normalized shared model → diagnosis layer → owner-assigned next action.
The diagnosis layer should generate alerts only after freshness, duplicate, missing-join, tracking-change, and backfill checks pass. Each alert needs a comparison period, minimum-data threshold, exclusions, likely explanations, accountable owner, and an action such as inspect tracking, adjust budget, refresh an angle, or launch a creative test.
For example, rising spend with falling new-customer revenue should first trigger checks for attribution lag, conversion-definition changes, tracking disruption, audience movement, and creative fatigue. Google itself notes that conversion reporting can differ because of counting rules, timing, and conversion sources, which is why the diagnosis should show evidence rather than announce a cause.
This is where customer signals matter. A stable platform CPA alongside worsening product objections may point to a message-quality problem, while broad creative decline across audiences may justify a new concept brief. Teams can use testing memory to connect current evidence to the outcomes of prior tests before creating the next one.

A strong next-action workflow does not merely identify a declining metric. It establishes whether the change is real, what explanations remain plausible, who owns the investigation, and what should be tested or changed next. That gives weekly performance reviews a practical, evidence-led operating rhythm.
How Can Deepsolv Help You Operationalize This?
Deepsolv gives performance teams a practical way to make this operating model usable. We connect performance evidence to the creative units, customer responses, and previous tests that explain it, so a dashboard review can end in a ranked decision rather than another spreadsheet. Our approach keeps the platform record available while making a common decision view explicit: the metric, attribution basis, source, freshness, limitation, and owner all travel with the recommendation. That means your team can investigate a sudden swing without losing the historical context that makes the answer believable. It also gives creative, growth, and analytics colleagues one working vocabulary for weekly reviews. If you are moving from disconnected reporting toward evidence-backed test planning, we can help you design the model, preserve history, and turn its output into a repeatable operating rhythm across the team. Book a Deepsolv demo
FAQs on Cross-platform Campaign Signal Consolidation
Can We Add Platform Conversion Totals Together?
Not by default. Platforms can count different events, windows, and modeled activity. Keep source totals separate, then compare them only through a documented attribution view.
What Belongs in the Shared Signal Model?
Use account, campaign, delivery group, ad, creative, audience, conversion, and date. Include immutable identifiers, extraction timestamps, raw measures, data owners, and join-coverage checks for every source.
How Often Should the Decision Layer Refresh?
Set refresh expectations by source and decision urgency. Daily suits planning, while intraday monitoring needs freshness labels, late-data handling, and safeguards against premature conclusions in reviews.
How Do We Protect Campaign History During Migration?
Archive raw exports, creative assets, identifiers, dashboard logic, and screenshots. Reconcile representative periods, version changed definitions, retain lineage, and keep historical reference access for audits.