


TL;DR
We diagnose ad fatigue across Meta and TikTok by separating creative-level response decay from audience, delivery, and measurement changes. This guide shows our baseline-and-peer monitoring method, platform-aware alert logic, and a safe way to turn public ad patterns into replacement hypotheses before we refresh, pause, or expand an audience.
When a portfolio contains many creative variants, the hard part is knowing whether a weak ad is tiring, misdelivered, or merely noisy. TikTok advises using three to five assets per ad group, partly because a crowded group can leave some ads with too little delivery to assess.
Ad fatigue across Meta and TikTok is a sustained decline in a creative’s response after delivery, audience, and measurement changes are accounted for. We diagnose it by comparing the ad with its own baseline and matched peers across hook or hold rate, CTR, frequency, CVR, CPA, and delivery, then use competitor ads only to source replacement ideas.
This guide gives you a diagnostic matrix, a practical five-step triage flow, platform-aware alert logic, and a replacement-angle process for teams managing more than 40 variants.
What Counts as Ad Fatigue Across Meta and TikTok?
A lower CTR is a warning, not a diagnosis. In our workflow, an ad is fatigued only when its response declines persistently against both its own stable history and genuinely comparable ads. That distinction matters because audience saturation, auction pressure, broken measurement, and learning volatility can produce the same unpleasant CPA chart. Our guide to creative fatigue versus audience saturation goes deeper on the first of those lookalikes.
Start with structural changes. If clicks and video response are stable but reported conversions suddenly fall after an event, attribution, or site change, inspect tracking before replacing the creative. Meta notes that browser errors, connectivity issues, and ad blockers can affect pixel measurement, which is why its Conversions API guidance recommends a more reliable event connection.
| Diagnosis | Typical Pattern | Main Confounder | First Response |
|---|---|---|---|
| Creative Fatigue | One creative’s hook, hold rate, or CTR decays versus peers | Placement or format shift | Refresh execution or angle |
| Audience Saturation | Frequency rises and reach weakens across several ads in one audience | Retargeting strategy | Expand or alter the audience |
| Auction Pressure | CPM rises broadly while attention remains stable | Budget or bid change | Review delivery conditions |
| Tracking Error | CVR and CPA break without an attention decline | Event or attribution change | Audit measurement |
| Normal Variance | Low volume or recent edits create inconsistent movement | Learning phase | Continue observation |
A good diagnosis asks, “What changed for this creative that did not change for its peers?” If nothing is isolated at the creative level, do not call it fatigue yet.
Which Metrics Reveal Creative Fatigue Before CPA Rises?
Attention metrics usually move before business-outcome metrics, but none can stand alone. We read the creative’s opening response, engagement depth, click response, frequency, and delivery context together, then use conversion metrics to confirm whether the decline is commercially meaningful.
| Signal | Calculation Or Field | What It Can Reveal | Key Confounder | Likely Response |
|---|---|---|---|---|
| Hook Rate | 2-second views divided by impressions | Opening frame or first message is weakening | Autoplay and placement mix | Test a new opening |
| Hold Rate | 6-second views divided by impressions | Viewers lose interest after the hook | Video length and pacing | Recut proof or sequence |
| CTR | Clicks divided by impressions | Interest or relevance is declining | Audience and auction mix | Compare with peers |
| Frequency | Impressions divided by reach | Repeated exposure may be increasing | Retargeting design | Check saturation |
| CVR | Conversions divided by clicks | Post-click quality is weakening | Landing page or offer change | Audit destination and offer |
| CPA | Spend divided by conversions | The business outcome is deteriorating | Attribution lag and low volume | Confirm before pausing |
| Delivery | CPM, spend, reach, placements | Distribution conditions changed | Bid, budget, learning | Diagnose delivery first |
Which Signals Lead?
For video, hook and hold metrics are the earliest clues because they show whether people are still choosing to watch. TikTok defines a 2-second view as a video playing for at least two seconds in an impression session, while its 6-second measure uses a longer attention threshold. Use those video definitions consistently within each platform instead of treating every view metric as interchangeable.
CTR is the next useful signal, especially when the same creative formerly earned stronger response under the same objective and audience type. Pair it with frequency and reach movement. A click decline with climbing frequency can support a fatigue hypothesis. A click decline with a sudden placement shift may simply reflect delivery moving to a less responsive inventory source.
Which Signals Confirm the Problem?
CVR, CPA, and ROAS tell you whether attention decay has become a commercial problem. They lag because attribution takes time and conversion volume is thinner than impression volume. A creative can lose some CTR while retaining high-intent clickers, so pausing on CTR alone can cut a still-profitable ad prematurely.
We connect creative versions to outcomes through creative angle performance tracking, so teams can see whether an opening, proof point, or offer actually changed the result rather than relying on a generic creative label.
What Should You Compare?
Compare an ad to a stable baseline and to a peer median, not to an account-wide average. A short video in broad prospecting should not be benchmarked against a retargeting carousel, a different optimization event, or a newly launched creative still receiving exploratory delivery.
How Do You Track More Than 40 Variants Without Manual Checks?
At scale, the solution is not more morning dashboard tabs. It is a consistent record that identifies the creative version, audience cell, optimization event, attribution setting, placements, launch cohort, and material campaign edits. That creates peer groups whose movement actually means something.
Build Comparable Peer Groups
Group creative by platform, objective, conversion event, audience type, placement set, format, and attribution configuration. Keep a version ID for every meaningful change, including a new hook, thumbnail, caption, offer, landing page, or call to action. Our approach to consolidating cross-platform campaign signals is built around preserving that context instead of flattening every result into one score.
Use the earliest stable evaluation window as the creative’s baseline. Avoid treating the first few hours or a recently edited ad as evidence of fatigue. TikTok says ad groups should achieve about 50 conversions before exiting learning, and its automated rule conditions include CTR, CPM, CPA, CVR, clicks, impressions, and conversion metrics.
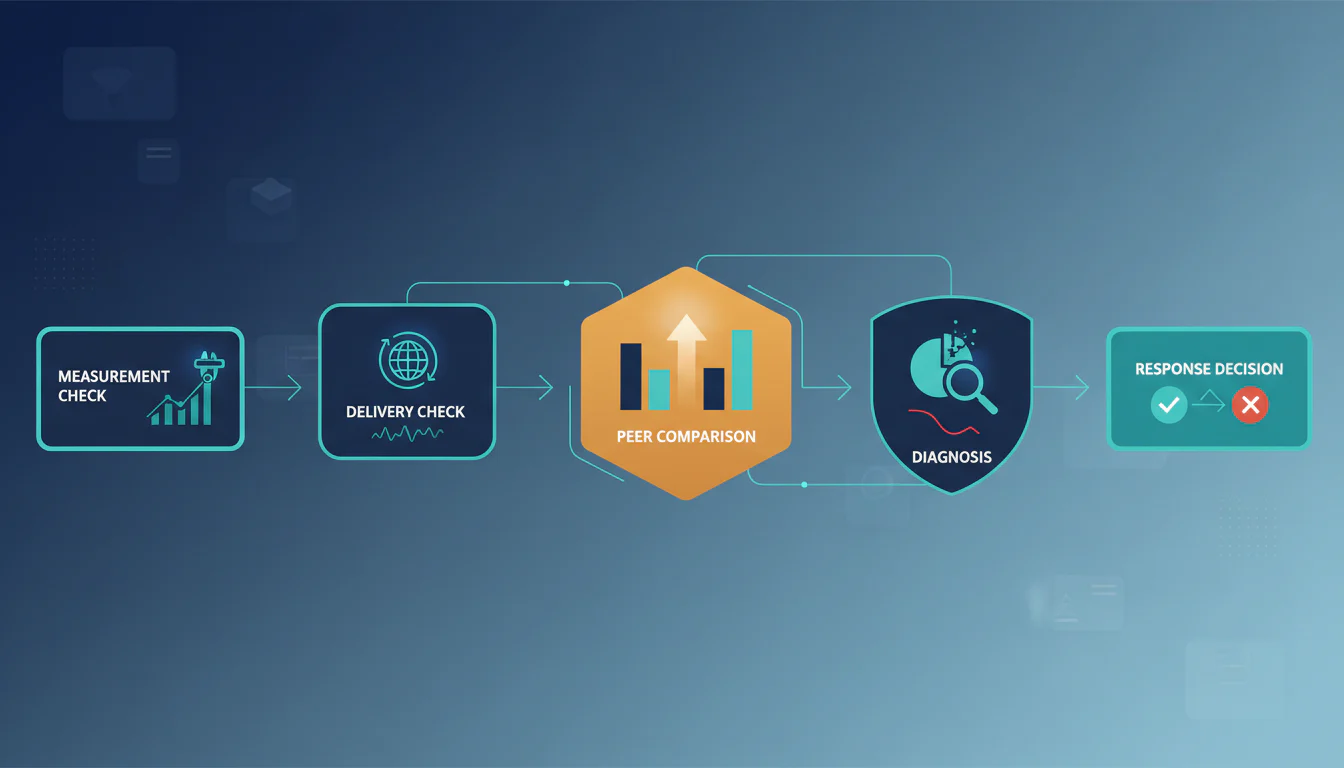
Run the Five-Step Triage Flow
-
Validate Measurement: Check event quality, attribution settings, conversion lag, and landing-page changes.
-
Check Delivery Context: Review spend, CPM, reach, placements, bids, budgets, and learning status.
-
Compare The Creative: Measure baseline change and peer-group change across hook rate, hold rate, CTR, frequency, and CVR.
-
Classify The Cause: Assign the most likely explanation, creative fatigue, saturation, auction pressure, tracking error, or variance.
-
Act And Record: Refresh, expand, adjust the offer, pause, or observe, then attach the action and outcome to the creative version.
Rank by Risk, Not by Raw CTR
A useful monitoring view ranks ads by decay evidence and spend at risk. An ad with slightly weaker CTR but little spend may warrant observation. An ad with persistent peer-adjusted attention decline and meaningful spend deserves a faster investigation.
This approach also creates test memory. Instead of recycling a failed opening because it looks new in Ads Manager, teams can see exactly which message, format, and audience combination was already tried. For a separate public-market feed, continuous competitor ad tracking can preserve the patterns worth turning into new hypotheses.
How Should Meta and TikTok Alerts Handle Delivery and Attribution?
Meta and TikTok can both show a falling CTR, but they do not expose identical attention, delivery, or attribution mechanics. Compare trends within each platform first, then align conversion events and reporting windows before you compare outcomes across platforms.
| Comparison Dimension | Meta | TikTok | Monitoring Rule |
|---|---|---|---|
| Attention Proxy | Two-second continuous views and longer video metrics | Two-second and six-second video views | Define the metric before comparing it |
| Delivery Environment | Multiple placements can shift delivery automatically | Video-first inventory and video-specific engagement fields | Segment by placement where possible |
| Attribution | Confirm the ad-set configuration | CTA and EVTA can use 1 or 7 days, VTA can be off or 1 day | Hold windows constant within peer groups |
| Native Fatigue Signal | No published universal pause frequency | Fatigue Index at 0.6 signals reduced ability to reach new users | Use native signals as triage inputs |
| Learning Context | Delivery may be unstable during learning | About 50 conversions is guidance for leaving learning | Avoid immediate automated action |
Meta’s two-second continuous video view generally requires at least half the video pixels to be on screen, while TikTok’s view definitions use different conditions. That is why we never label one platform’s hook metric as “better” without first matching the underlying viewing criteria.
For alerting, use native signals and account-specific control limits instead of a universal frequency cutoff. TikTok documents a Fatigue Index of 0.6 as a sign that an ad group has lower ability to reach new users and drive results. Treat that as an investigation trigger, not an automatic deletion rule.
Our recommended escalation logic is simple: observe one leading-signal decline, investigate when peer-adjusted decay persists with delivery context, and refresh or pause only when two leading signals deteriorate and CVR or CPA confirms the cost. Creative test stop rules should preserve that evidence trail so a team can distinguish a disciplined decision from an overreaction.
How Can Competitor Ads Shape a Replacement Angle?
Public competitor research is useful after diagnosis, not before it. It can show which hooks, formats, proof types, offers, and calls to action are active in a category. It cannot reveal another advertiser’s audience mix, attribution setup, margins, conversion quality, or reason for changing creative.
Meta’s Ad Library shows ads currently active across its products. That makes it useful for observing public executions, but it does not make public activity a performance diagnosis for your account.
Use the evidence to produce a replacement brief, then validate it through your own controlled test.
-
Change The Attention Mechanic: Move from a product demonstration to an objection-led opening, testimonial, founder story, comparison, or proof sequence.
-
Change The Proof Type: Replace repeated claims with a new demonstration, customer outcome, expert explanation, or visual contrast.
-
Separate Offer From Creative: If the offer changes with the hook, record it as an offer test rather than crediting the result solely to the creative.
-
Protect Test Memory: Check whether the same concept already failed with a similar audience, format, or landing page.
-
Test Before You Generalize: A public pattern is a hypothesis. Your account’s measured response decides whether it earns more spend.
We use creative intelligence software to make replacement research easier to organize, while keeping public-market evidence separate from owned-account performance data.
How Deepsolv Helps Teams Monitor Creative Decay
At Deepsolv, we built our workflow for the moment a dashboard says performance is down but cannot explain what changed. We organize ad-level trends, creative versions, peer groups, and market evidence into a decision record, so your team can separate a real creative decline from a delivery shift before reacting. That means your next move can be a refresh, an audience change, an offer review, or patience, supported by the signals that actually moved. We also preserve the test memory behind each decision, so a new concept does not repeat a failed hook or confuse a fresh edit with a new angle. Use the same diagnostic matrix across Meta and TikTok, without handing attribution decisions to a black box. If you manage a growing creative portfolio and want a clearer path from observation to the next test, bring your team’s evidence together and book a demo
FAQs on Ad Fatigue Across Meta and TikTok
How Do I Detect Ad Fatigue Across Meta and TikTok?
Compare each creative with its stable baseline and matched peers, then confirm sustained attention decline through frequency, delivery, conversion, and measurement checks before changing spend.
Which Metrics Reveal Creative Fatigue Before CPA Rises?
Hook rate, hold rate, and CTR usually warn first. CVR and CPA confirm commercial impact later, while CPM or placement shifts may indicate delivery changes.
What Tools Monitor CTR Decay Across Meta Campaigns?
Use native reporting for platform checks, then keep peer groups, version history, and account-specific alerts in one shared analytics workflow built for creative testing.
Can Competitor Ads Help Replace Fatigued Creative?
Competitor ads reveal active hooks, formats, proof, and offers worth testing. They cannot reveal your audience mix, attribution settings, conversion quality, or decline cause.