
Turning Paid-Social Intelligence Data into Next Actions with a Paid-Social Signal-to-Action Workflow


TL;DR
At Deepsolv, we turn paid-social reporting into evidence-backed next actions by separating observations from explanations, testing alternatives, and recording confidence. This guide shows how to connect creative attributes to outcomes, protect campaign history during a workflow change, and validate the rebuilt reporting layer before cutover.
A reporting total is not always final. Google Analytics notes that attributed conversion data can update for up to 12 days, which is one reason a dashboard change needs interpretation before it becomes a budget or creative decision.
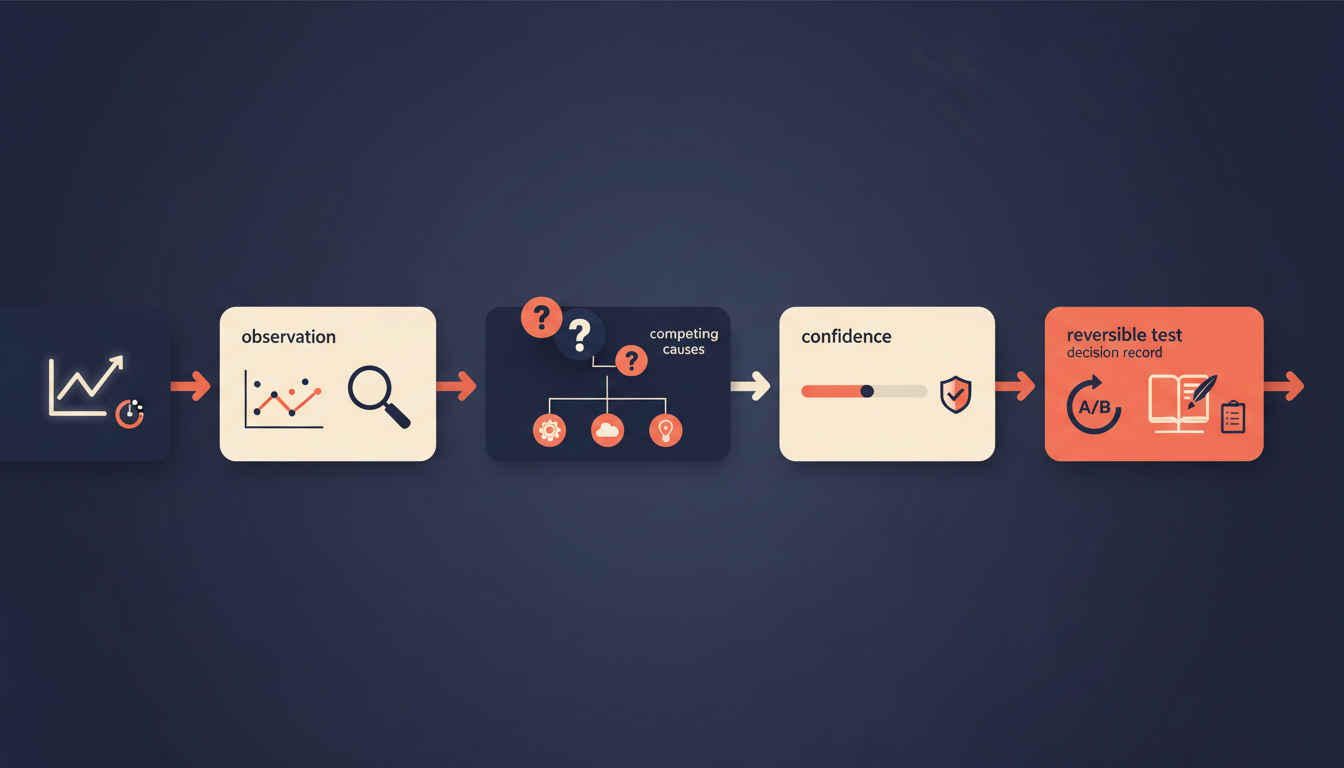
We turn dashboard data into reliable next actions by separating the observed change from its likely causes, testing competing explanations, stating confidence, and choosing a reversible move. Before we rebuild any workflow, we preserve raw exports, definitions, attribution settings, and the decision record that explains the history.
This guide explains our paid-social signal-to-action workflow, how we connect creative and media evidence, and how we protect trustworthy campaign history during a reporting migration.
How Does a Paid-Social Signal-to-Action Workflow Turn Data into Decisions?
A dashboard can centralize reporting, forecasting, planning, benchmarks, and recommendations. It can also automate bids, budgets, delivery, and asset rotation. None of those capabilities remove the marketer’s job of deciding whether a change is real, what caused it, and what should happen next.
We start by making the dashboard output answer a decision question. That prevents a rise in cost, a winning asset, or a suggested reallocation from becoming an unexamined instruction.
| Dashboard Output | Decision Question | Testable Hypothesis | Smallest Reversible Action | Caveat |
|---|---|---|---|---|
| Cost per acquisition rises while spend is stable | Did efficiency decline, or did measurement change? | A creative or audience shift explains the change | Split performance by asset, audience, placement, and attribution setting | Recent conversion reporting can change |
| One asset leads on clicks but not purchases | Is the message attracting low-intent traffic? | The opening works, but the proof or offer does not | Hold media constant and test a revised proof frame | Click-through rate is not a conversion proxy |
| Spend shifts toward one ad set | Is delivery responding to genuine lift? | The apparent winner holds after audience and creative controls | Cap the reallocation and compare performance | Delivery follows the configured optimization event |
| Cross-channel totals change after a rebuild | Is the issue a source, join, or time-zone difference? | A definition mismatch explains the variance | Reconcile one day and campaign before backfilling | Attribution models assign credit differently |
Record the Observation Before Explaining It
We record the metric, segment, date range, comparison period, baseline, and raw counts. The observation should be plain: “purchase rate fell in a specific placement after a new asset group launched.” It should not contain an explanation disguised as a fact.
That discipline matters because reports can differ through filters, thresholds, data processing, and modeled behavior. We link that observation to paid social prioritization so the team can rank its next investigation by potential impact and reversibility.
Separate Likely Causes from Competing Explanations
We then list a likely cause, at least one competing explanation, and the evidence still missing. Creative, audience, placement, frequency, budget, conversion-event setup, and attribution configuration all remain separate variables until the evidence connects them.
This is where automated optimization and strategy diverge. Automation can execute a rule, but it cannot establish whether a weaker outcome came from creative fatigue, audience saturation, an offer change, a tagging problem, or normal variation.
State Confidence Before Recommending a Move
Confidence should be explicit. High confidence means the result is consistent across the relevant slices and survives basic measurement checks. Medium confidence means the direction is useful but another explanation remains plausible. Low confidence means the best next action is an audit or contained test, not a major reallocation.
A confidence label gives creative and media teams permission to learn without overclaiming. It also makes the decision log useful when someone later asks why a campaign changed.
Choose the Smallest Useful Next Action
We turn the diagnosis into a single action with an owner, guardrail, decision date, and success measure. That might mean testing one message angle against a control, protecting a winning asset from a broad budget shift, or correcting a metric definition before any optimization occurs.
When possible, we hold other variables constant. Meta’s testing guidance recommends keeping all but the tested variable unchanged and allowing at least 14 days for sufficient test data.
What Turns Asset Attributes into Better Creative and Media Decisions?
An asset only becomes strategically useful when its attributes are visible alongside delivery and conversion outcomes. We tag the creative features that a team can actually repeat or change: format, orientation, opening device, message angle, proof type, offer, creator style, call to action, placement, audience, and launch date.
That lets us distinguish “this ad won” from “this product demonstration opened with a specific proof and converted within a defined audience and placement.” It also creates a clearer handoff between media operators and creative teams, especially when we use creative angle tracking to connect a message pattern to conversion outcomes.
A high click-through rate with weak purchase rate is not proof that an asset is bad. It is an observation that may suggest curiosity without qualification, a promise that the landing experience does not fulfill, or a mismatch between placement and message. We test those explanations before refreshing the entire concept.
Native format can matter, but it is not a universal answer. In a platform-sponsored meta-analysis of 15 A/B tests, a tested vertical-video setup reported 5% lower cost per result and 11% higher conversion rate. We treat that as a useful starting hypothesis, then validate it against the account’s own measurement and audience conditions.
When a concept is underperforming, our ad hook framework helps separate a weak opening from a viable angle that needs better proof, a different offer, or a more suitable placement.
Which Definitions Can Change a Dashboard Recommendation?
A recommendation is only as trustworthy as the definitions beneath it. Before we act, we confirm the conversion event, attribution model and window, source system, currency, time zone, exclusions, sampling status, calculation formula, and data-refresh schedule.
Attribution is especially important because it changes how credit is allocated across touchpoints. Google Analytics describes an attribution model as the rules or algorithm used to assign that credit, so two reports can be internally correct while answering different questions.
We document custom metrics with their numerator, denominator, inclusion rules, owner, and intended decision. “Blended efficiency” is not a sufficient definition if one report includes view-through conversions and another does not. “Revenue” is not the same measure if one source uses gross sales and another removes returns or tax.
Consistent naming is part of the same measurement discipline. Campaign labels, source values, and asset tags should use a governed taxonomy, because a capitalization or naming variation can fragment performance into different rows. Our creative testing memory keeps those definitions and prior decisions connected, rather than relying on scattered dashboards and team recollection.
How Do You Migrate Campaign History Without Losing Trust?
A workflow migration is not a copy-and-paste exercise. We treat it as a measurement-preservation project: retain the original raw history, preserve the logic that produced each dashboard, rebuild fields before visualizations, and compare settled data before a cutover.
The migration inventory should include campaign, ad set, ad, and asset IDs; daily exports; dashboard definitions; calculated metric formulas; attribution settings; currencies; time zones; naming taxonomies; data-source and join logic; scheduled reports; automation rules; and decision logs.
Audit and Freeze the Source Definitions
We assign an owner and export date to every dashboard and data source. We then snapshot the history at the lowest useful grain, typically date, account, campaign, ad set, ad, asset, placement, spend, delivery, conversion, and revenue fields.
The audit should also identify tracking changes, backfills, missing periods, and model changes. Those annotations prevent a normal historical discontinuity from looking like a migration failure. We capture qualitative evidence beside performance data when it affects the next hypothesis, using our comment analysis guide to structure feedback for future tests.
Export Raw Data and Supporting Logic
Raw exports need their surrounding context. We preserve filters, calculated fields, dashboard screenshots, refresh schedules, and source permissions with the file itself. That gives the new workflow a traceable starting point instead of a collection of unexplained totals.
Campaign identifiers and tags are especially valuable for reconstruction. Google’s campaign tagging guidance explains how source, medium, campaign, and content values help identify campaigns and differentiate creative, provided naming remains consistent.
Rebuild Fields Before Rebuilding Views
We rebuild raw tables first, then joins, calculations, metrics, and dashboards. Alerts and automations come last. This order makes it possible to test each layer without hiding a field-mapping issue behind a polished report.
Our creative intelligence software approach is designed around this continuity: preserve the evidence, map the language teams use to describe their creative, and make future decisions traceable to the history that supports them.
Validate in Parallel Before Cutover
We run the legacy and rebuilt workflows together long enough to compare settled periods, not same-day reporting. Each discrepancy receives a classification: expected definition difference, refresh-timing difference, source limitation, mapping defect, or unresolved issue.
| Validation Check | Compare At The Same Grain | Investigate When Results Differ |
|---|---|---|
| Spend | Date, account, currency, time zone | Currency conversion, exclusions, or late adjustments |
| Delivery | Date, campaign, ad set, ad, placement | Join duplication, deleted entities, or filters |
| Conversions | Event, attribution window, model, date | Event definition, lookback window, or modeled reporting |
| Campaign History | Immutable IDs and date continuity | Renamed entities, missing records, or taxonomy changes |
| Dashboard Metrics | Formula and source fields | Different numerators, denominators, or refresh schedules |
Time zones deserve special attention. Google notes that a property time-zone change can affect export timing, create discrepancies, or even skip a daily export. We do not declare cutover complete until owners understand and approve every material variance.
How Can Deepsolv Help Us Turn Reporting into Action?
At Deepsolv, we help paid-social teams preserve the learning that dashboards usually leave scattered. We turn campaign outputs, asset attributes, customer feedback, and conversion evidence into a working memory that shows what changed, why it may have changed, and which next test is worth running. Our approach keeps the analysis connected to the creative decisions people actually need to make, rather than producing another layer of charts. We can help your team define a durable taxonomy, connect angles to conversion outcomes, prioritize reversible tests, and retain the decision trail behind each result. That makes a workflow change less risky: your history stays useful, your new reports remain auditable, and your next actions have named evidence and owners. If you want to see how we apply that discipline to your own paid-social process with your full team today, Book a Demo
FAQs on Paid-Social Signal-to-Action Workflow
Can Automation Prove Why Paid-Social Results Changed?
No. Automation can execute rules, but it cannot prove why results changed. We compare creative, media, measurement, and external explanations before authorizing the next test.
What Must Be Exported Before Changing Reporting Workflows?
Export raw daily data, immutable IDs, dashboard logic, calculated-metric formulas, attribution settings, taxonomies, time zones, schedules, and the decision log. Together, these records make historical comparisons explainable.
Why Can Campaign Totals Differ Across Dashboards?
Totals can differ when sources use different time zones, currencies, filters, conversion events, attribution models, processing schedules, or joins. Reconcile definitions before treating either total as wrong.
How Long Should Parallel Validation Run Before Cutover?
Keep both workflows running until settled periods match at the chosen grain, exceptions are documented, and owners approve them. Same-day comparisons alone are not enough.