Facebook Ads Hold Rate: Formula, Benchmarks, Audit Sheet
Facebook ads hold rate is ThruPlays divided by 3-second video plays, the share of 3-second viewers who reach 15 seconds or the end of a shorter video. Name the denominator before comparing.

By Sachit Sharma, CEO & Founder · Updated 10 Oct 2026

Key takeaways
- 01Facebook ads hold rate = ThruPlays ÷ 3-second video plays × 100: of the people who watched the first 3 seconds, the share who reached a ThruPlay.
- 02Compare hold rates only inside one formula and one length bucket, and put the denominator in every column name.
- 03On videos shorter than 15 seconds, hold rate measures finishing the video, not holding attention past the opening.
- 04Before you call one ad's hold rate worse than another's, check the volume: telling 22% from 16% takes about 669 3-second plays per ad (our model).
In this article
- 1What is Facebook ads hold rate and how do you calculate it?
- 2Which hold rate formula should you use?
- 3What is a good hold rate on Facebook ads?
- 4Does video length change what hold rate means?
- 5How many 3-second plays do you need before a hold rate gap is real?
- 6How do you audit hold rate in your own account?
- 7How does hold rate help you choose the next test?
- 8Frequently asked questions
Run the same 479 video ads through two hold rate formulas and you get two different verdicts. Measured as ThruPlays (Meta's count of videos played to completion or for at least 15 seconds) divided by impressions, the median hold rate was 4.6% in one agency's analysis of 17 US ad accounts, June to August 2026.
Divide by 3-second plays instead and the same ads score far higher. Both are valid ratios, but they answer different questions. Ads Manager has no standard hold rate column, so every team builds its own, and a benchmark only helps if it uses the same formula as yours.
The denominator changes decisions: a healthy ad can look broken next to a band quoted on another formula, and a weak ad can look fine.
This page gives you the formula, the sample medians under each denominator, the sample size you need before one ad beats another, and an audit sheet to fill in from your own export.
What is Facebook ads hold rate and how do you calculate it?
Facebook ads hold rate measures how many people who watched the first 3 seconds of your video kept watching to a ThruPlay. The formula is ThruPlays ÷ 3-second video plays × 100. You build it from two counts Ads Manager already reports.
Three terms, as Meta defines them:
Definition
Definition
Definition
Worked example, an illustrative ad we built from the sample medians in the next section: 20,000 impressions, 4,180 3-second plays and 920 ThruPlays.
- Hook rate (3-second plays ÷ impressions): 4,180 ÷ 20,000 = 20.9%. Our guide to calculating hook rate covers that metric in full.
- Hold rate (ThruPlays ÷ 3-second plays): 920 ÷ 4,180 = 22.0%.
- ThruPlays ÷ impressions: 920 ÷ 20,000 = 4.6%.
Hook rate is the share of impressions that stopped the scroll. Hold rate only looks at the people the opening already won.
Which hold rate formula should you use?
Use ThruPlays ÷ 3-second plays, and write the denominator into the column name. It separates the body of the video from the opening. Dividing by impressions bakes hook rate into the result, so a weak opening makes a good body look bad.
The versions are linked by one identity: ThruPlays ÷ impressions = hook rate × hold rate. The sample below fits it. We call it Biddy's sample: 479 video ads from 17 US ad accounts, each account spending $100K or more over June to August 2026, with $10.1M combined spend on the ads kept. Its median hook rate was 20.9%. Its median "3-second-to-ThruPlay retention," the same ratio as hold rate here, was 22%. Its own "hold rate," ThruPlays ÷ impressions, had a median of 4.6% (Biddy, 2026). We multiplied the first two: 0.209 × 0.22 = 4.6%. Medians do not always multiply exactly, but here they line up.
| Metric | Formula | Question it answers | Sample median |
|---|---|---|---|
| Hook rate | 3-second plays ÷ impressions | Did the opening stop the scroll? | 20.9% |
| Hold rate | ThruPlays ÷ 3-second plays | Did the body keep viewers the opening won? | 22% |
| ThruPlays ÷ impressions | ThruPlays ÷ impressions | How much of the audience got to a ThruPlay? | 4.6% |
Some teams put 15-second plays or 75%-watched plays in the numerator. Those are different metrics from ThruPlays, so do not mix them in one column.
What is a good hold rate on Facebook ads?
A good hold rate is one that beats the median of your own comparable ads. For reference, the median was 22% on ThruPlays ÷ 3-second plays and 4.6% on ThruPlays ÷ impressions, where the middle half of ads fell between 3.0% and 7.3% (Biddy, 2026).
That is one agency's sample of top-spending ads from 17 accounts, with each ad spending at least $1,000. Treat it as a reference point, not a target; your account will differ.
Three things follow:
- If 22% looks low next to a 40% or 50% band you have seen elsewhere, check the formula, the video length and how many ads sit behind that band before you worry. A band is usable only when it states all three.
- High scores did not mark the big spenders. On ThruPlays ÷ impressions, the ads Meta spent most on did not have higher hook or hold rates than ads that spent less, and ads with higher hook rates did not have a lower cost per purchase (Biddy, 2026). That result was measured on the impressions formula; do not carry it over to ThruPlays ÷ 3-second plays. Our guide to hook signals versus conversion data explains why attention metrics and purchase results need to be read separately.
- The median ad's average watch time was about 4 seconds (Biddy, 2026). Our inference is that most plays end well before 15 seconds, which makes a ThruPlay a high bar.
Our recommendation: set your target from the median of ads in the same length bucket, placement and audience temperature, where cold means people who have not interacted with your brand.
Does video length change what hold rate means?
Yes. A ThruPlay is a play to completion or for at least 15 seconds, whichever comes first, so on a video shorter than 15 seconds a ThruPlay is a completion (Meta). Hold rate then measures finishing, not holding.
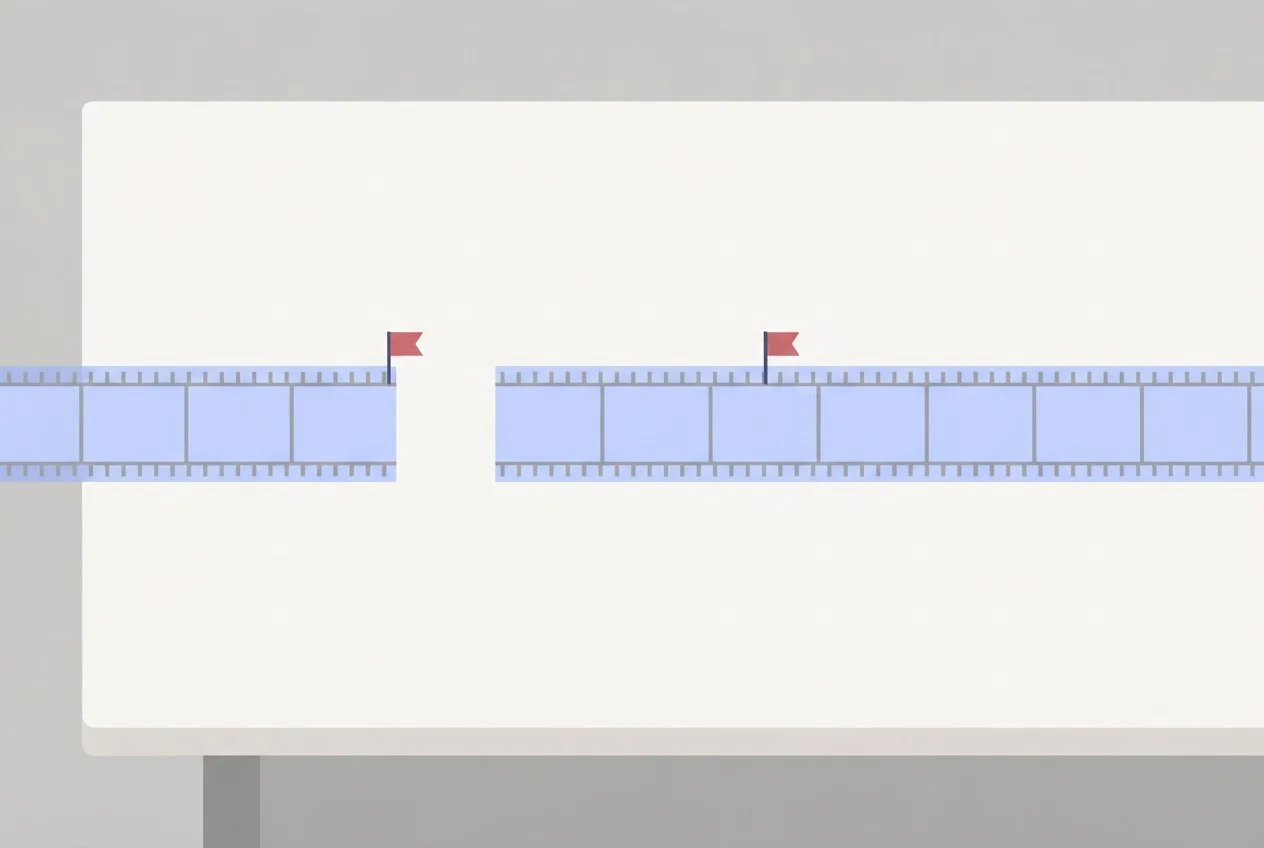
The same 15-second checkpoint also asks different things at different lengths. On a 45-second video it asks for a third of the runtime. On a 16-second video it asks for almost all of it. This is our inference from the definition.
So put every ad into a length bucket, for example under 15 seconds, 15 to 30 seconds and over 30 seconds, and compare only inside a bucket. A 10-second ad scoring higher than a 40-second ad tells you nothing about which creative is better.
How many 3-second plays do you need before a hold rate gap is real?
The count depends on your bucket median and the gap you want to catch. From a 22% median, spotting a drop to 16% takes about 669 3-second plays per ad; 18% takes about 1,567; 12% takes about 220. Below the count, treat the gap as a direction, not a result.
This is our model, the standard two-proportion sample size for comparing two ads:
n = (1.96 · √(2 · p̄ · (1 − p̄)) + 0.84 · √(p1 · (1 − p1) + p2 · (1 − p2)))² ÷ (p1 − p2)²
Here p1 is your bucket's median hold rate, p2 is the hold rate you decide in advance is worth catching (the gap is p1 − p2), and p̄ = (p1 + p2) ÷ 2. The 1.96 gives 95% confidence, meaning a 5% chance of calling a gap real when none exists. The 0.84 gives 80% power, meaning an 80% chance of catching a real gap of that size. It assumes viewers are independent. As a check, p1 = 0.25 and p2 = 0.30 gives about 1,250, the figure in our hook rate guide.
Hold rate's denominator is 3-second plays, so count plays, not impressions. The impressions column divides by the sample's median hook rate of 20.9%, rounded to the nearest 10.
| p1 → p2 | 3-second plays per ad | Impressions per ad at a 20.9% hook rate |
|---|---|---|
| 22% → 12% | about 220 | about 1,050 |
| 22% → 16% | about 669 | about 3,200 |
| 22% → 18% | about 1,567 | about 7,500 |
For example, 1,567 ÷ 0.209 = 7,497, which rounds to about 7,500.
How do you audit hold rate in your own account?
Fill in this audit sheet from an Ads Manager export of your video ads. Each step has a pass or fail, and an ad only earns a diagnosis if it passes steps 1 to 5.

Build three columns, each named with its denominator.
Create custom metrics for hook rate (3-second plays ÷ impressions) and hold rate (ThruPlays ÷ 3-second plays), and keep ThruPlays ÷ impressions as a third. Pass: each header contains the "÷". Fail: a column called just "Hold rate."Run the reconciliation.
For each ad, hook rate × hold rate should equal ThruPlays ÷ impressions. Pass: within 0.1 percentage point. Fail: a column uses a different numerator or denominator than you think.Tag the length bucket.
Pass: no comparison crosses buckets.Fix the gap before you look.
Take p1 as the median hold rate of the bucket, choose p2, and compute n with the formula above. Pass: the ad has at least n 3-second plays. Fail: label the result "directional."Compare to the bucket median.
Pass: the ad's hold rate is at or below p2. Fail: leave the ad alone.Check cost per purchase.
Pass: the ad's cost per purchase is above your account median, so the weakness shows in cost. Fail: at or below the median means hold rate alone is not a reason to change the ad.Write one sentence.
"Because hold rate is [x] points below the median, we will test [change] in [the first 3 seconds / the body]."
For step 7, read hook rate and hold rate together. These readings are hypotheses to test, not proof of cause:
| Hook rate | Hold rate | Likely meaning | Test |
|---|---|---|---|
| High | Low | Opening wins attention, body does not deliver on it | Reach the promise sooner, cut the intro |
| Low | High | Body is fine, opening does not stop the scroll | New first frame or first line |
| Low | Low | Opening and body both miss | Rework the angle before the edit |
| High | High | Working on attention | Check cost per purchase before scaling |
How does hold rate help you choose the next test?
Hold rate tells you where viewers leave. It does not tell you what to put there instead, and that is the decision that matters.
At Deepsolv we combine ad-performance data, competitor activity, customer signals and past ad learnings into a ranked weekly test plan and execution-ready creative briefs. The audit sheet's step 7 gives you one candidate test. Our job is to rank candidate tests against each other so your team starts each week with the one most worth running. Our guide to analyzing Facebook ads and choosing your next test goes deeper on that call.
To check an opening before you spend on it, export its first frame as a still image and upload it to our free Attention Heatmap. It shows predicted attention on a frame, not your hook rate or hold rate, and our guide on reading an attention heatmap explains when to trust it.
If you want a ranked plan built from your own account, book a demo with our founding team, and ask us about pricing there.
Get a ranked weekly test plan from your own account
Frequently asked questions
Sources
- 1.Hook Rate and Hold Rate Benchmarks for Meta Ads (2026): What 479 Top-Spending Videos Show, Biddy
- 2.About video ad metrics on Facebook and Instagram, Meta Business Help Center
- 3.Hook Rate: How to Calculate It and What Is a Good One, Deepsolv