Glossary
Facebook ads conversion rate
A Facebook ads conversion rate is the share of ad clicks that end in a chosen action, such as a purchase. Compare it only with figures for the same action.

By Sachit Sharma, CEO & Founder · Updated 23 Oct 2026
On this page
- 01Definition
- 02Quick facts
- 03Introduction
- 04What is a Facebook ads conversion rate?
- 05Which Facebook ads conversion rate benchmark should you compare with?
- 06Why do the same ads show different conversion rates in different places?
- 07How do you check your conversion rate against your own break-even?
- 08What does a low conversion rate mean for creative testing?
- 09Which terms are close to conversion rate?
- 10How Deepsolv handles it
- 11Example
- 12Related terms
- 13Frequently asked
What is a Facebook ads conversion rate?
A Facebook ads conversion rate is the percentage of people who click your ad and then complete the action you chose, such as a purchase or a lead form.
Key takeaways
- Match the action, the click and the attribution window before comparing with any benchmark (Meta changed its click attribution in March 2026).
- Published purchase figures (1.53% median from Triple Whale) sit at less than a fifth of the lead-form average (8.54% from WordStream), because a purchase is a harder action than a form fill.
- The 9.21% figure is old and should be treated as history, not a target.
- Your break-even conversion rate is a better yardstick than any industry average.
Quick facts
- Formula
- Conversions divided by link clicks, times 100
- Purchase median
- 1.53% for ecommerce purchases on Meta (Triple Whale, August 2025 to July 2026)
- Lead campaign average
- 8.54% (WordStream, 2026)
- Click attribution change
- Meta changed how it counts clicks in March 2026
Introduction
Search for a good Facebook ads conversion rate and the published answers differ by more than a factor of five. WordStream's 2026 average for lead campaigns is 8.54%, while Triple Whale's median for ecommerce purchases on Meta is 1.53%. Both are real, and both are normal.
The gap exists because a form fill and a purchase are different events. A form fill takes seconds and costs the visitor nothing, while a purchase asks for payment details, so the two convert at very different rates. Reading them as one scale is how a healthy store ends up feeling like a failing one.
Benchmarks also differ in what they divide by and in the months they cover, which makes a quoted rate hard to use without that context. Even Meta's own counting of clicks changed in March 2026, so a rate collected before then may not match what your account shows today.
This entry defines the term, sorts the benchmarks by what they count, and gives a break-even check that needs only your own numbers.
What is a Facebook ads conversion rate?
The usual formula is conversions divided by link clicks, times 100. If 2,000 people click and 30 buy, the rate is 1.5%.
Same ads, three different conversion rates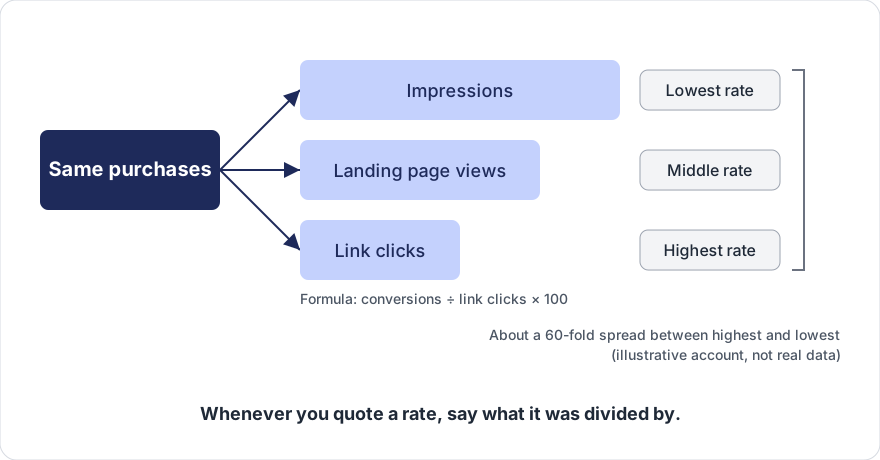
The "conversion" is whatever event you tell Meta to count. The same account can show three different rates, depending on what you divide by. The table shows an illustrative account, not real data.
Same ads, same purchases, and about a 60-fold spread between the highest and lowest rate. Whenever you quote a rate, say what it was divided by.
- Denominator
- Link clicks (2,000)
- Calculation
- 30 ÷ 2,000
- Rate
- 1.5%
- Denominator
- Landing page views, meaning clicks where the page loaded (1,600)
- Calculation
- 30 ÷ 1,600
- Rate
- 1.875%
- Denominator
- Impressions (100,000)
- Calculation
- 30 ÷ 100,000
- Rate
- 0.03%
Which Facebook ads conversion rate benchmark should you compare with?
Compare with a benchmark for the same action. Purchases and lead forms live on different scales, and a benchmark that does not name its action should be ignored.
Recomputing cost per purchase from Lebesgue's CPM (cost per 1,000 impressions), click-through rate (CTR) and conversion rate for all eleven verticals in its table gives, in every one, an implied cost higher than Lebesgue's own reported customer acquisition cost (CAC, the ad cost per new customer), so use its rates as a rough range only.
Benchmarks also move with the season they cover, so date any you use. For a store, treat your own last 30 days as the baseline and use a benchmark only as a sanity check. A 9% purchase target is a sign you are reading a lead-form or a 2017 number.
- Benchmark
- WordStream, 2017 report
- Action counted
- Conversion goals, all industries
- Figure
- 9.21% average (the figure usually quoted from this report; sample of 256 US WordStream clients, November 2016 to January 2017)
- Benchmark
- WordStream, 2026
- Action counted
- Lead campaigns
- Figure
- 8.54% average
- Benchmark
- Triple Whale, August 2025 to July 2026
- Action counted
- Ecommerce purchases on Meta
- Figure
- 1.53% median, across more than 40,000 brands
- Benchmark
- Lebesgue, table posted 9 March 2026
- Action counted
- Conversions (action not defined by Lebesgue)
- Figure
- 0.37% (hardware and automotive) to 1.54% (food and drink)
Why do the same ads show different conversion rates in different places?
Because the rate depends on three choices that are easy to change by accident: the denominator, the attribution window and the optimization goal, meaning the event you tell Meta to find more of, such as purchases or link clicks. Most disagreements between Ads Manager, Meta's campaign dashboard, a store dashboard and a benchmark come from one of these.
- Denominator. Link clicks, landing page views and impressions give different rates, as the table above shows.
- Attribution window. Click-through now counts only link clicks, so Ads Manager conversions are lower than before the change. Benchmarks collected before March 2026 may use the older, broader click definition. Other tools use their own windows, so their numbers rarely match Ads Manager.
- Optimization goal. In one example Jon Loomer describes, a page converting at 10% organically fell to well under 1% once the campaign was optimized for link clicks. Cheap clicks are not buyers.
How do you check your conversion rate against your own break-even?
Divide your cost per link click by the most you can pay for one customer. The result is the conversion rate you need to break even, and no industry average will tell you that.
Break-even conversion rate = cost per link click ÷ (average order value × contribution margin). Contribution margin is the share of each order left after product, shipping and fees.
Run these four tests before you judge a rate:
- Event. Pass: the Results column in Ads Manager shows purchases or leads. Fail: it shows link clicks or landing page views.
- Denominator. Pass: your rate and the benchmark are both per link click. Fail: either one divides by something else.
- Window. Pass: your rate and the benchmark use the same attribution setting. Fail: they differ, or the benchmark was collected before March 2026 and may count clicks more broadly.
- Volume. Pass: clicks multiplied by your break-even rate gives at least about 10 expected conversions. Fail: below that, one lucky or unlucky day swings the rate. This threshold is a rule of thumb.
What does a low conversion rate mean for creative testing?
A low conversion rate means the break-even check failed. If tracking and the page are sound, the next lever is which creative you test, because different ads bring different buyers. An ad that earns fewer but better-matched clicks can raise the rate and lower cost per sale.
Fixing tracking, checkout or landing pages is a separate job. For those, and for the four-way diagnosis of stalled ads, start with Facebook Ads Not Working.
How Deepsolv handles it
Deepsolv is a creative intelligence platform for Meta advertising teams. It combines ad-performance data, competitor activity, customer signals and past ad learnings into ranked weekly creative test plans and execution-ready creative briefs. See how to analyze Facebook ads and choose your next test for the method, and use the Meta ads budget and creative test calculator to size how many clicks you need.
If the check points at creative, see Deepsolv pricing or book a personalized demo with our founding team.
Example
A $60 average order with a 40% contribution margin allows a $24 cost per customer. At $1.00 per link click the break-even conversion rate is 1.00 ÷ 24 = 4.2%, and at $0.50 per click it is 2.1%. Against a 1.5% purchase median, both stores lose money, however "normal" 1.5% looks. These numbers are invented for illustration.
Frequently asked
Sources
- 1.WordStream, Facebook Ads Benchmarks 2026, WordStream
- 2.WordStream, Facebook Advertising Benchmarks (February 2017), WordStream
- 3.Triple Whale, Ecommerce Benchmarks 2026, Triple Whale
- 4.Lebesgue, Facebook Ads Benchmarks by Industry 2026 (posted 9 March 2026), Lebesgue
- 5.Meta, click attribution announcement (March 2026), Meta
- 6.Meta Business Help Center, About conversion rate ranking, Meta
- 7.Do Not Make This Mistake with Conversion Rate and Meta Ads, Jon Loomer Digital, 2023-03-06