


TL;DR
We use customer signals to explain what people want or resist, and performance data to judge what campaigns delivered. This guide shows how we normalize Meta and Google data, link feedback to creative and campaigns, choose an operating architecture, and migrate historical reporting without losing the decisions behind the numbers.
Paid media decisions get harder when language from customers lives apart from campaign reporting. In a 2024 global feedback study, Qualtrics surveyed 23,730 consumers across 23 countries and regions, a useful reminder that feedback arrives through more than one channel.
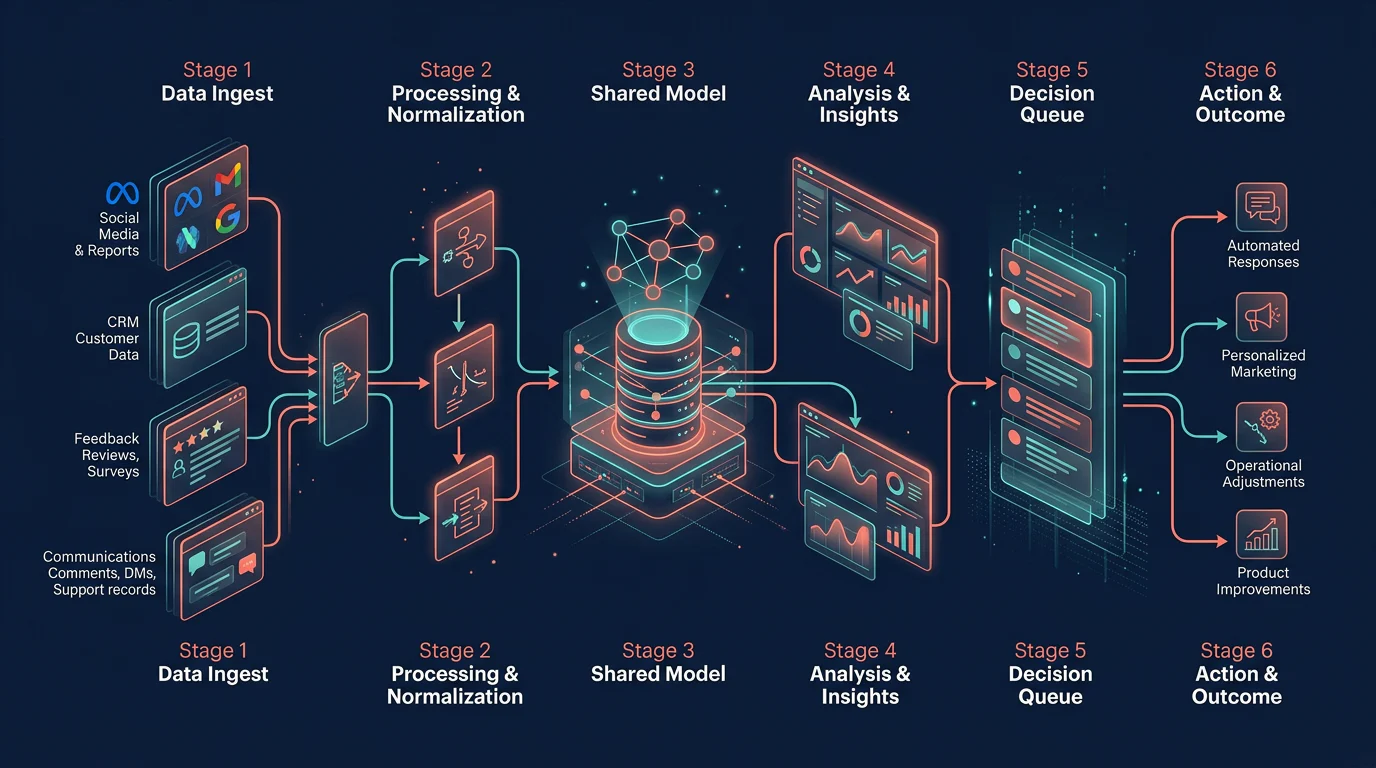
Customer signals vs performance data is not an either-or choice: customer signals explain what audiences say, want, question, or resist, while performance data shows what happened after delivery. We connect both through shared campaign, creative, audience, date, and taxonomy keys, preserving native attribution so evidence forms hypotheses and normalized outcomes evaluate them.
Below, we show how we consolidate the inputs, make them comparable, choose the right operating model, and preserve history during a reporting migration.
Customer Signals vs Performance Data: What Guides Ad Decisions?
We separate these inputs because they answer different questions. Customer evidence gives us explanatory context, while campaign metrics give us evaluative evidence. One can suggest a new message to test, but it cannot prove that message improved a business outcome.
| Dimension | Customer Signals | Performance Data |
|---|---|---|
| Question Answered | What language, needs, objections, or desires are people expressing? | What did the campaign deliver? |
| Sources | CRM notes, reviews, surveys, comments, DMs, and support records | Meta and Google campaign, ad set or ad group, ad, creative, spend, and conversion reports |
| Units | Verbatim text, theme, sentiment, issue count, request frequency | Spend, impressions, clicks, conversions, conversion value, CPA, and ROAS |
| Typical Latency | Near-real-time through post-interaction collection | Depends on platform refreshes and conversion maturity |
| Failure Modes | Selection bias, duplicate posts, sarcasm, and incomplete tags | Attribution differences, modeled conversions, time-zone, and currency mismatches |
When we work with customer signals vs performance data, we preserve the difference rather than compressing both into a single score. Google explains that reported conversion totals can include observed and modeled activity, so we label the measurement context before comparing results through conversion modeling.
We also use feedback to investigate apparent creative fatigue, not to declare it by instinct. Our ad fatigue guide helps teams separate a weakening message from delivery, audience, or measurement changes.
How Do We Consolidate Meta and Google Data Without Copy-Pasting?
We start with a shared reporting contract, not a new dashboard. That contract defines the grain of each row, the business time zone, the currency convention, the conversion event, and the attribution view that supports a decision.
We retain raw source data before creating normalized fields. Google recommends caching downloaded entity data locally and using change signals to identify updates, instead of repeatedly rebuilding reporting from live calls, in its reporting guidance.
Define the Comparison Rules
We define a canonical conversion and name any alternative views. We record native account time zone, currency, objective, attribution setting, and conversion definition, then calculate standardized KPIs in separate fields. This keeps an apples-to-apples decision view from erasing platform truth.
Extract, Normalize, and Join the Inputs
-
Inventory sources: Record every account, feedback channel, owner, reporting grain, and refresh cadence.
-
Freeze metric definitions: Agree on the conversion event, reporting currency, time zone, attribution comparison window, and KPI formulas.
-
Capture raw snapshots: Retain platform IDs, native spend, source currency, attribution setting, extraction time, and source-report version.
-
Normalize comparable fields: Standardize dates, currencies, objectives, conversion definitions, and approved attribution views without overwriting source values.
-
Join through shared keys: Use campaign, creative, audience, date, landing page or UTM, angle, and taxonomy version.
-
Publish a decision view: Present raw metrics, normalized KPIs, customer themes, and exceptions together.
Reconcile Before Anyone Acts
We check record counts, spend totals, duplicate IDs, missing creative links, connector failures, and late-arriving conversions before a dashboard refresh. We also log conflicting attribution rather than forcing a false agreement between systems.
For a deeper operating playbook, we connect this process to our cross-platform consolidation workflow.
What Shared Model Connects Campaigns, Creative, and Feedback?
A usable model keeps creative context attached to performance. We do not flatten every ad into an isolated metric row, because the decision often concerns an angle, hook, offer, audience, or landing-page promise that spans multiple ads.
Google’s asset reporting shows why hierarchy matters: asset performance can be available at customer, campaign, or ad-group levels, with availability varying by ad type. We use that constraint to design a model that respects source granularity through asset reporting.
Our core dimensions are platform, account, campaign, ad set or ad group, ad, creative, audience, date, angle, landing page, and taxonomy version. Raw facts include spend, impressions, clicks, conversions, conversion value, currency, attribution window, and modeled or observed status. Customer-signal facts include source type, theme, polarity, frequency, date, and a linked campaign or creative when one exists.
We assign ownership as well. Performance owners control KPI definitions, creative owners control the angle taxonomy, and data owners approve schema changes. Our creative angle tracking method gives teams a practical way to maintain that shared language as tests accumulate.
Which Architecture Fits a Unified Advertising Signal System?
We choose the architecture based on source count, historical depth, tagging maturity, audit needs, and the person expected to maintain it. The right answer is not always the most complex system, but it must preserve source attribution and decision context.
| Option | Best For | Strength | Constraint | Keeps Source Attribution? |
|---|---|---|---|---|
| Spreadsheet Automation | Small, stable reporting scope | Fast to begin | Fragile as sources and taxonomy grow | Yes, with protected raw data |
| Lightweight BI | Shared KPI visibility | Repeatable reporting | Depends on disciplined input definitions | Yes |
| Warehouse | Multi-source history and auditability | Supports raw data, backfills, and durable joins | Requires data engineering and governance | Yes |
| Creative Intelligence Approach | Weekly creative decisions | Connects feedback, angles, assets, and outcomes | Still needs a trusted metric contract | Yes |
We use spreadsheet automation when the reporting scope is narrow and controlled. We use BI when the principal need is shared KPI visibility. We use a warehouse when history, auditability, and many joins matter. We use a creative-intelligence approach when the recurring question is what to test next, and why.
Our creative intelligence software is designed for that last decision layer, where feedback and measured outcomes need to remain connected.
How Do We Migrate Campaign History and Dashboard Logic?
A migration succeeds when it preserves the evidence behind prior decisions, not only current totals. For an 18-month history, we export both source data and the logic used to interpret it before rebuilding anything.
Google’s granular reporting retention is 37 months from June 2026, while higher-level monthly, quarterly, and yearly data remains available for 11 years. That makes an 18-month campaign-history migration possible in principle, but it does not replace an immutable export under the retention policy.

Freeze the Historical Record
We export campaign, ad set or ad group, ad, and creative IDs; daily performance; native currency; attribution settings; conversion definitions; dashboard formulas; filters; calculated fields; creative files; annotations; and taxonomy versions. We also capture dashboard screenshots and extraction timestamps so a rebuild does not depend on memory.
Rebuild the Logic Before the Interface
We map each legacy field to the shared model and identify fields that cannot map one-to-one. Then we rebuild calculations from the documented formula, not from a visually similar dashboard, and validate totals by account, campaign, date, and conversion type.
Run Parallel Validation and Keep Exceptions
We run both systems for a defined validation period and classify variance by attribution, time zone, currency, late-arriving conversion, conversion definition, missing record, or connector issue. Change-event and status data have limited lookback windows, so we do not treat them as substitutes for historical exports, as Google notes in its change limits.
Our creative testing memory approach helps preserve the hypotheses, annotations, and results that make historical performance useful after the migration. Teams can also document variance resolution through our feedback workflow.
How Deepsolv Helps Teams Make Better Advertising Decisions
At Deepsolv, we give teams a place to connect the language customers use with the ads and outcomes that follow. We help you turn comments, DMs, reviews, and support themes into organized creative evidence, then view those signals beside campaign and creative performance. Our approach keeps the decision trail intact: what the audience said, which angle we tested, where it ran, what it cost, and what changed next. That matters when a dashboard number alone cannot tell you whether to change a hook, an offer, an audience, or a landing page. We do not ask teams to choose intuition over measurement. We give them a working system for both, so weekly decisions remain explainable as campaigns, feedback, and creative libraries grow, with a clear, shared record for every paid-media decision your team makes across channels and reporting periods without losing its source context. Explore our approach in Book a demo
FAQs on Customer Signals vs Performance Data
Can Customer Signals Replace Performance Metrics?
No. Customer signals surface language, needs, and objections. Performance metrics record delivery and attributed outcomes. We connect both through shared keys, moving from hypotheses to informed decisions.
Can We Compare Meta and Google Metrics Directly?
No. We preserve native currency, time zone, conversion definition, and attribution window, then compare standardized metrics only within an agreed decision view. That prevents labels from hiding different measurement rules.
Which Fields Must We Retain in the Shared Model?
At minimum, retain platform, account, campaign, creative, audience, date, objective, conversion event, currency, attribution setting, and taxonomy version. We also retain raw source identifiers and extraction timestamps for auditability.
What Should We Preserve During a Reporting Migration?
Export formulas, filters, annotations, creative files, identifiers, and raw reports. Then log exceptions so historical decisions remain fully traceable across the migration process.