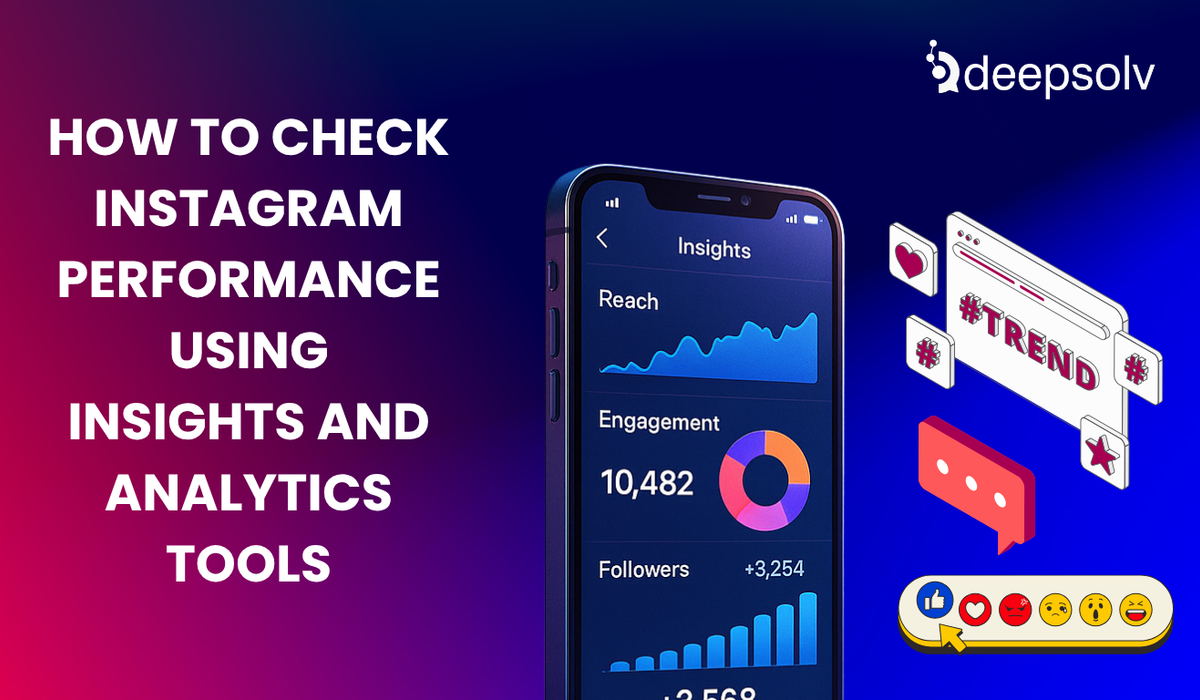
How to Check Instagram Performance Using Insights and Analytics Tools
5 min read
Published: 6/2/2025
In 2025, checking your Instagram performance isn’t optional- it’s the only way to grow. Whether you’re a solo creator, a small business, or a global brand, understanding how your content performs is the difference between random posting and strategic growth.
But how exactly do you check your performance on Instagram?
In this blog, we’ll break down:
- Which Instagram metrics actually matter
- How to use Instagram Insights and analytics tools
- How paid and organic performance differs
- What to do with the data once you have it
- Why platforms like Deepsolv are changing the analytics game
Let’s turn your dashboard from “numbers” into action.
Why Instagram Performance Metrics Matter
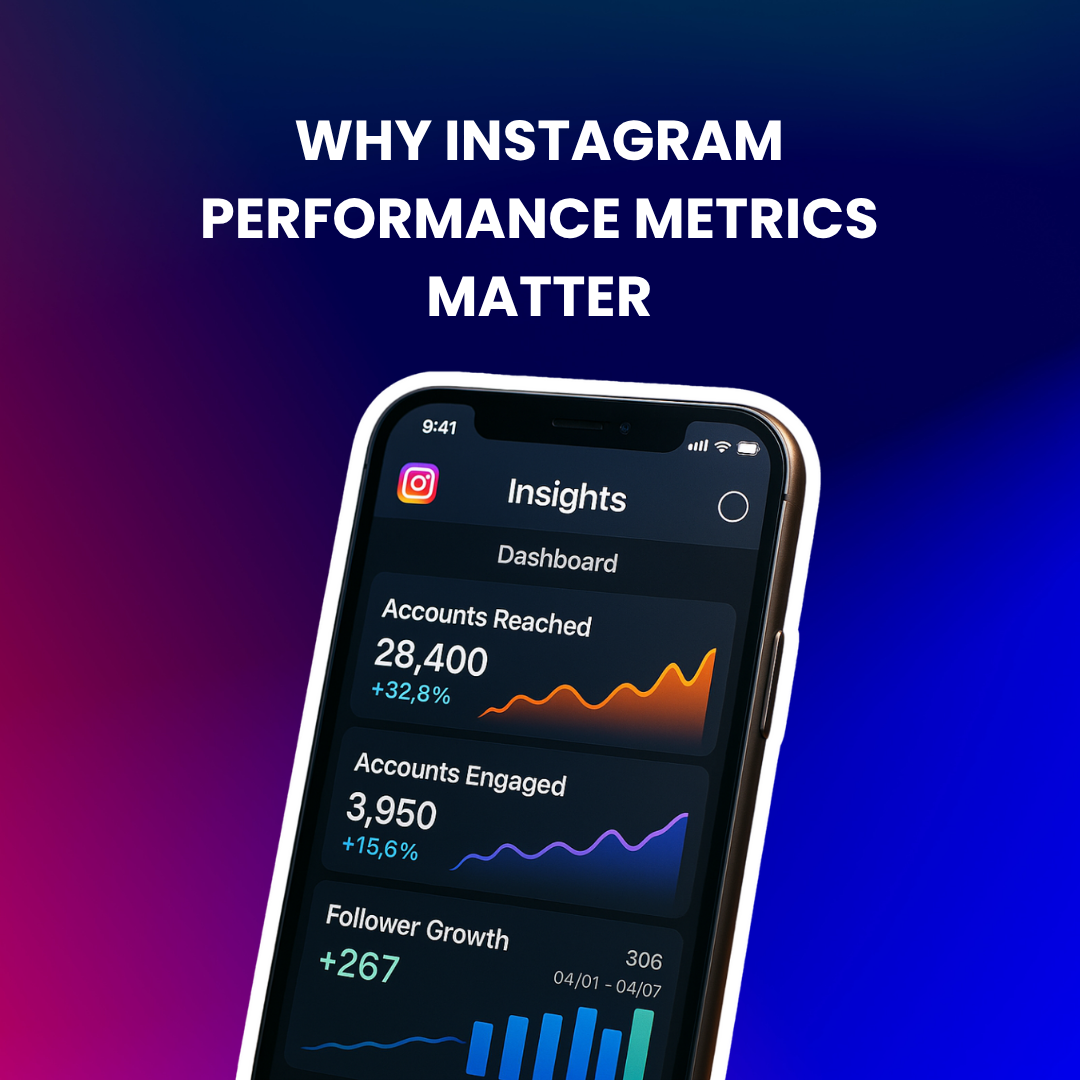
Whether you're aiming for brand awareness, conversions, or community building- what gets measured, gets managed.
With over 2 billion monthly active users, Instagram is no longer about likes alone. It’s about performance metrics that actually drive your goals.
For example:
- Reach = Visibility
- Saves & Shares = Value
- Profile Visits = Interest
- Link Clicks = Conversions
By learning to check and interpret these metrics, you can:
- Spot which content drives results
- Stop wasting time on what doesn’t
Build a strategy that grows your audience and revenue.
How to Check Instagram Performance Using Native Insights
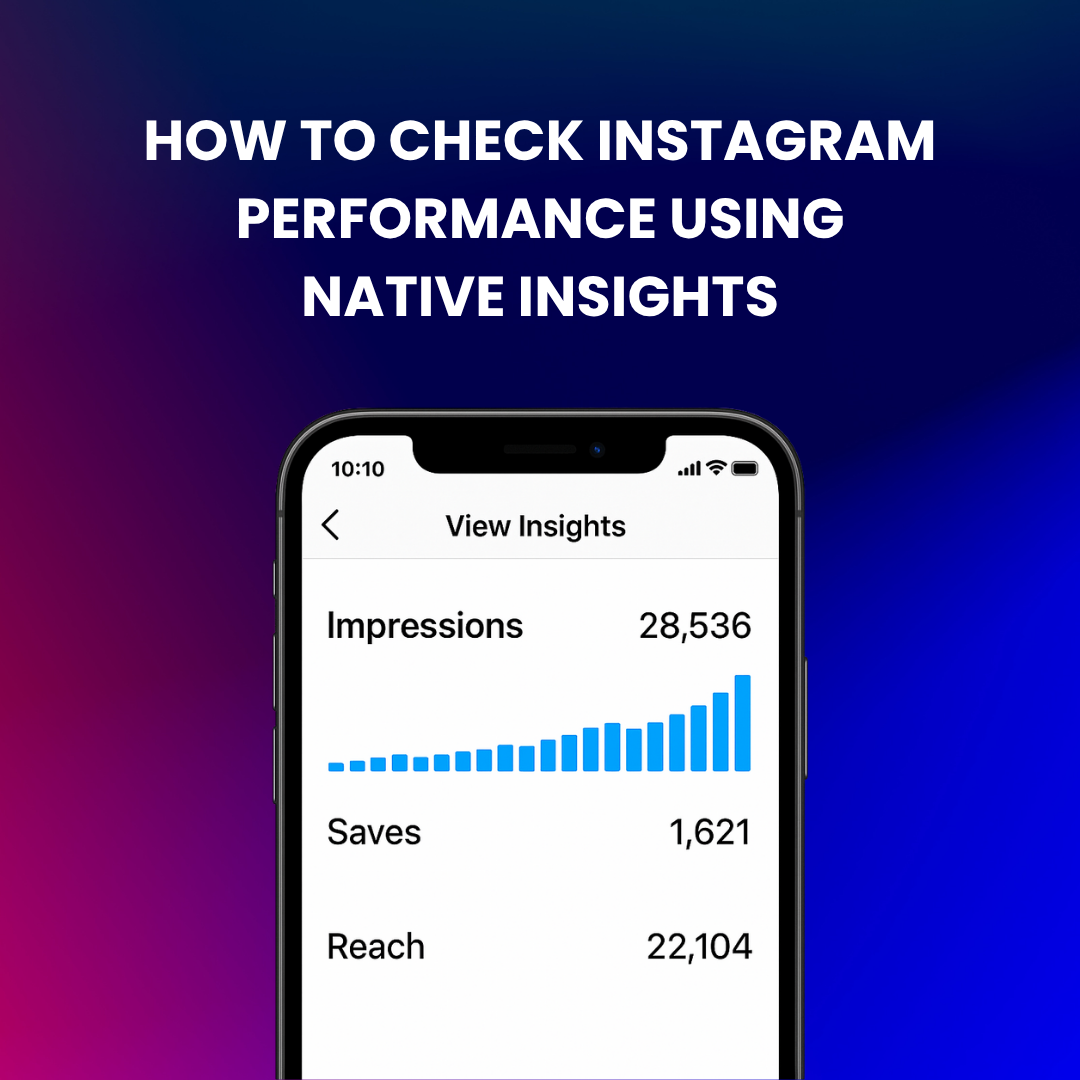
Instagram’s built-in Insights are available to all business and creator accounts. Here’s how to access them:
Step-by-step:
- Go to your profile
- Tap “Professional Dashboard”
- Select “Insights”
- Choose a date range (7/30/90 days)
- Explore tabs: Accounts Reached, Accounts Engaged, Total Followers
You can also tap “View Insights” below each post or story to get post-level data.
Core Metrics and What They Mean
| Metric | What It Tells You |
| Reach | Unique accounts that saw your post (key for brand awareness) |
| Impressions | Total views (including repeats) – useful to gauge repeat engagement |
| Engagement | Total likes, comments, shares, and saves |
| Engagement Rate | (Engagement ÷ Reach) x 100 – compare content effectiveness across posts |
| Saves & Shares | High saves = high value content; shares = content that inspires conversation |
| Profile Visits | Interest in your brand- how many people checked your bio after seeing a post |
| Website Clicks | Conversion intent- how many went from Instagram to your website or link-in-bio |
| Follower Growth | Are you gaining or losing followers? Analyze spikes with content calendar |
Going Beyond Instagram: Use Third-Party Analytics Tools
Native Insights are limited- especially if you want:
- Custom date ranges
- Exportable reports
- Competitive benchmarking
- Deeper audience insights
That’s where tools come in.
1. Deepsolv
Best for: Creators and brands who want AI-powered analytics + automationDeepsolv goes beyond numbers. It helps you:
- Understand trends from comments and DMs
- Segment audiences based on interactions
- See predictive engagement insights
- Automate performance reports
2. Hootsuite Analytics
Best for: Agencies or large teams managing multiple accountsIt auto-calculates engagement rate and shows post-level performance. Great export options (PDF, CSV).
3. Sprout Social
Best for: Visual reports & competitor comparisonSprout displays audience demographics, follower growth, and even Instagram Story taps in an easy interface.
4. Later
Best for: Content scheduling + basic analyticsShows best time to post, top-performing posts, and link-in-bio analytics. Lighter on advanced metrics.
5. Meta Business Suite
Best for: Ads and boosted post trackingLets you see organic vs paid performance across Facebook + Instagram. You can track click-throughs, ROI, and attribution.
Checking Paid Performance on Instagram
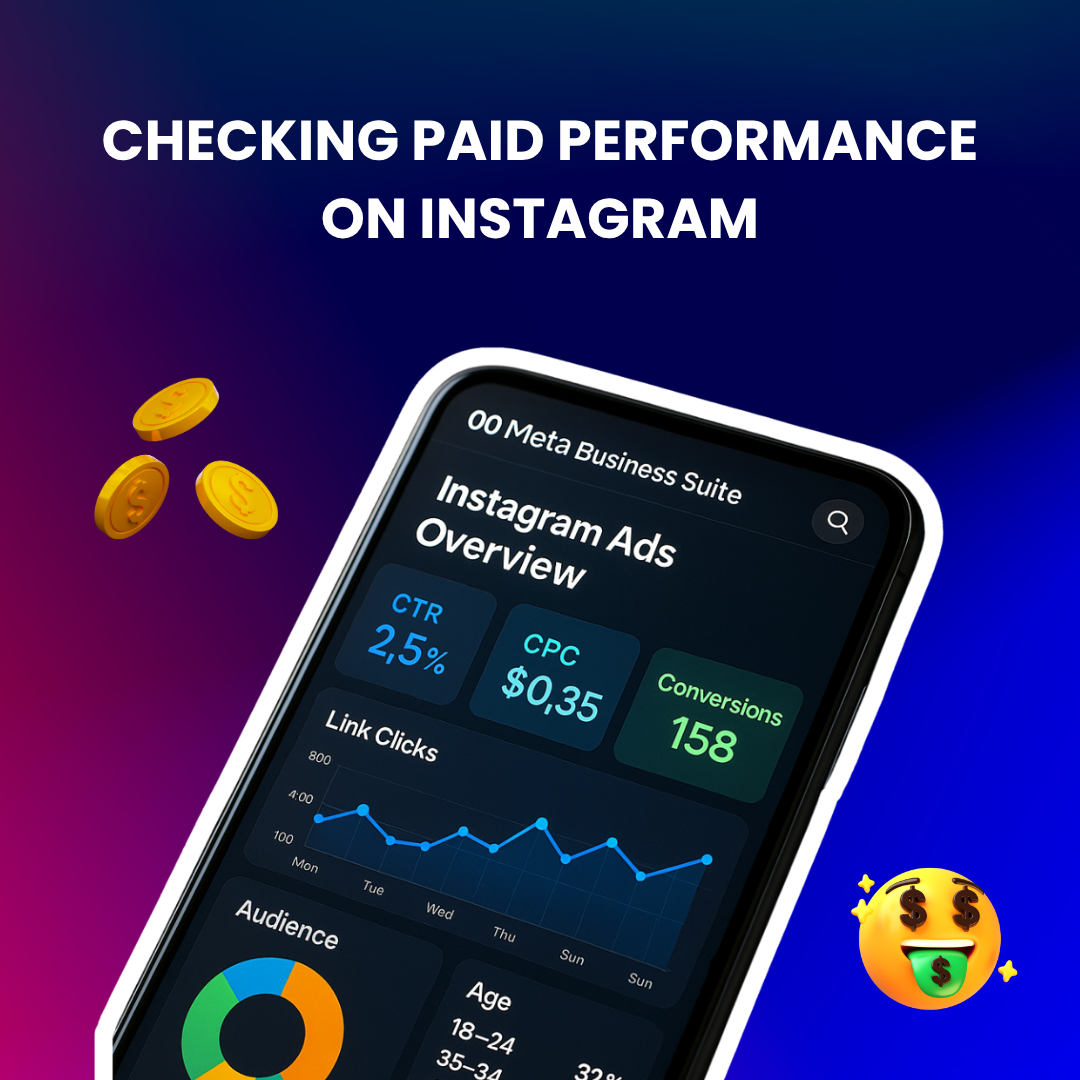
If you run Instagram ads, don’t just look at reach or likes. Track:
- CTR (Click-Through Rate): Are your ads actually getting clicks?
- CPC (Cost Per Click): Is your budget optimized?
- CPA (Cost Per Action): What’s the cost per signup, sale, or desired action?
For example:
- A 1.3% CTR is average
- CPC between $0.10–$0.25 is healthy for most industries
Run A/B tests with different creatives and analyze conversions in Meta Ads Manager. Pair this with insights from your website (e.g., via Google Analytics or Shopify dashboard) to connect performance across platforms.
Interpreting Performance: What to Do With the Data
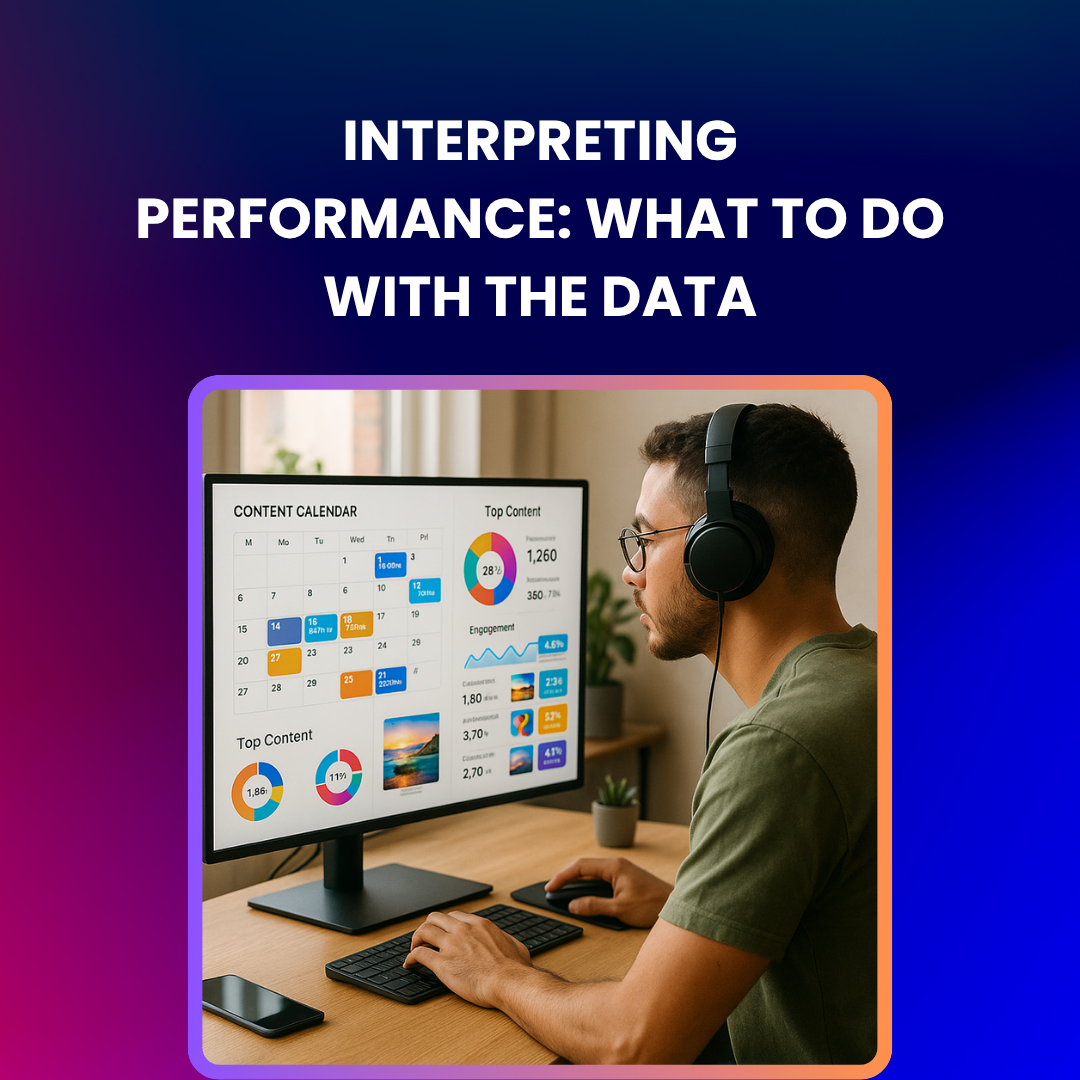
Data means little without context. Here’s how to act on it:
🚨 Reach but No Engagement?
Your content is visible but not resonating.
Fix: Make your captions more interactive. Add “save this if…” or “tag a friend.”
📉 Declining Follower Growth?
You may be posting irrelevant content.
Fix: Use Deepsolv to analyze what type of posts led to past spikes.
🔁 High Engagement, Low Conversions?
People love your content but it’s not converting.
Fix: Improve your bio links, CTA clarity, or landing page.
🕓 Inconsistent Post Timing?
You may be missing peak hours.
Fix: Use Instagram’s in-built Insights or Deepsolv’s activity heatmap to find when your audience is most active.
Track Competitors and Benchmark Your Industry
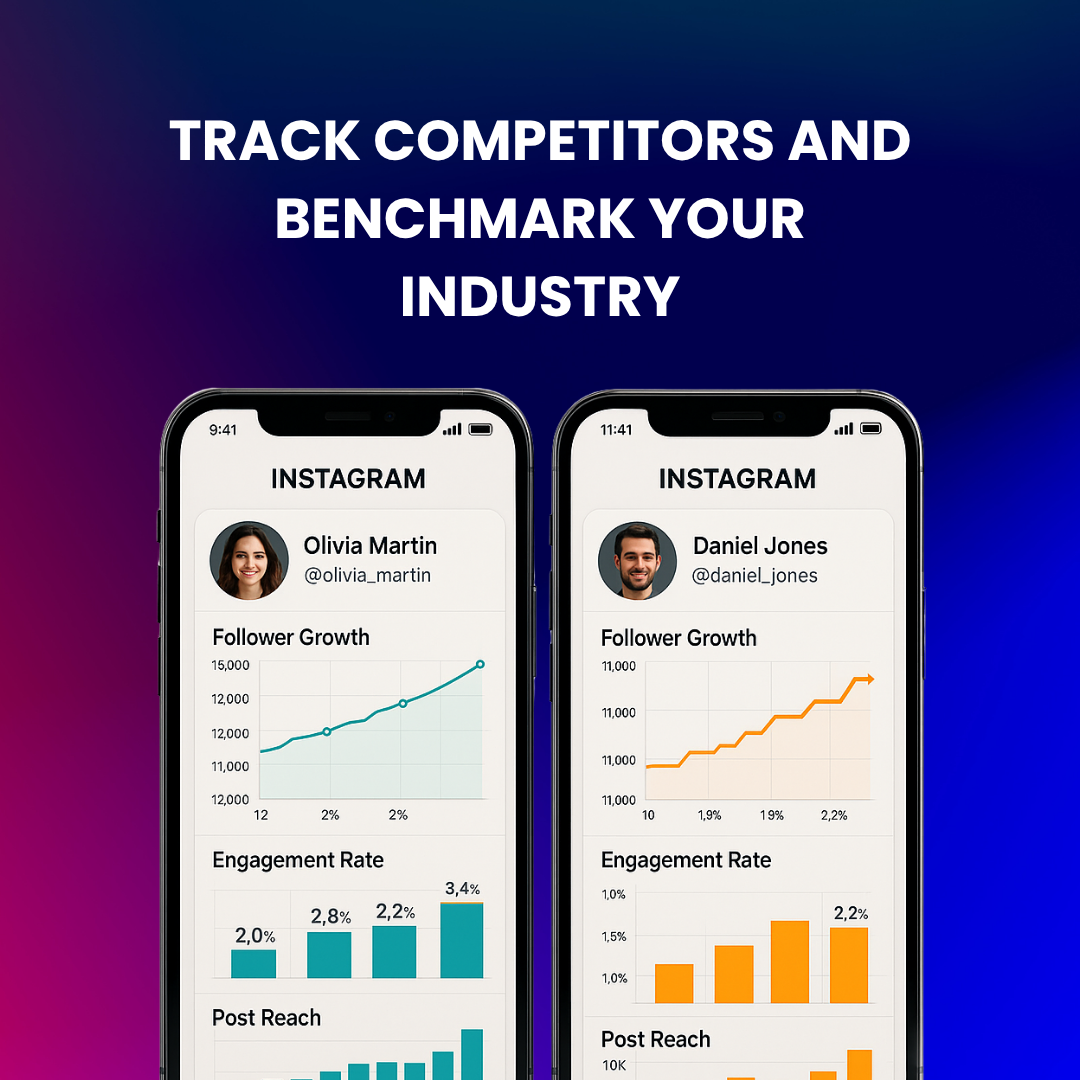
It’s not just about how you’re doing- it’s about how you compare.
Use tools like Socialinsider or Deepsolv’s competitive tracker to:
- Compare average engagement rate in your niche
- Track top-performing formats (Reels vs. Carousels)
- See what hashtags your competitors use
Example: A fashion brand realized its engagement rate was 1.2% while industry average was 1.9%. They shifted from product-only Reels to UGC content and gained 4,000 new followers in a month.
Why Deepsolv Makes a Difference
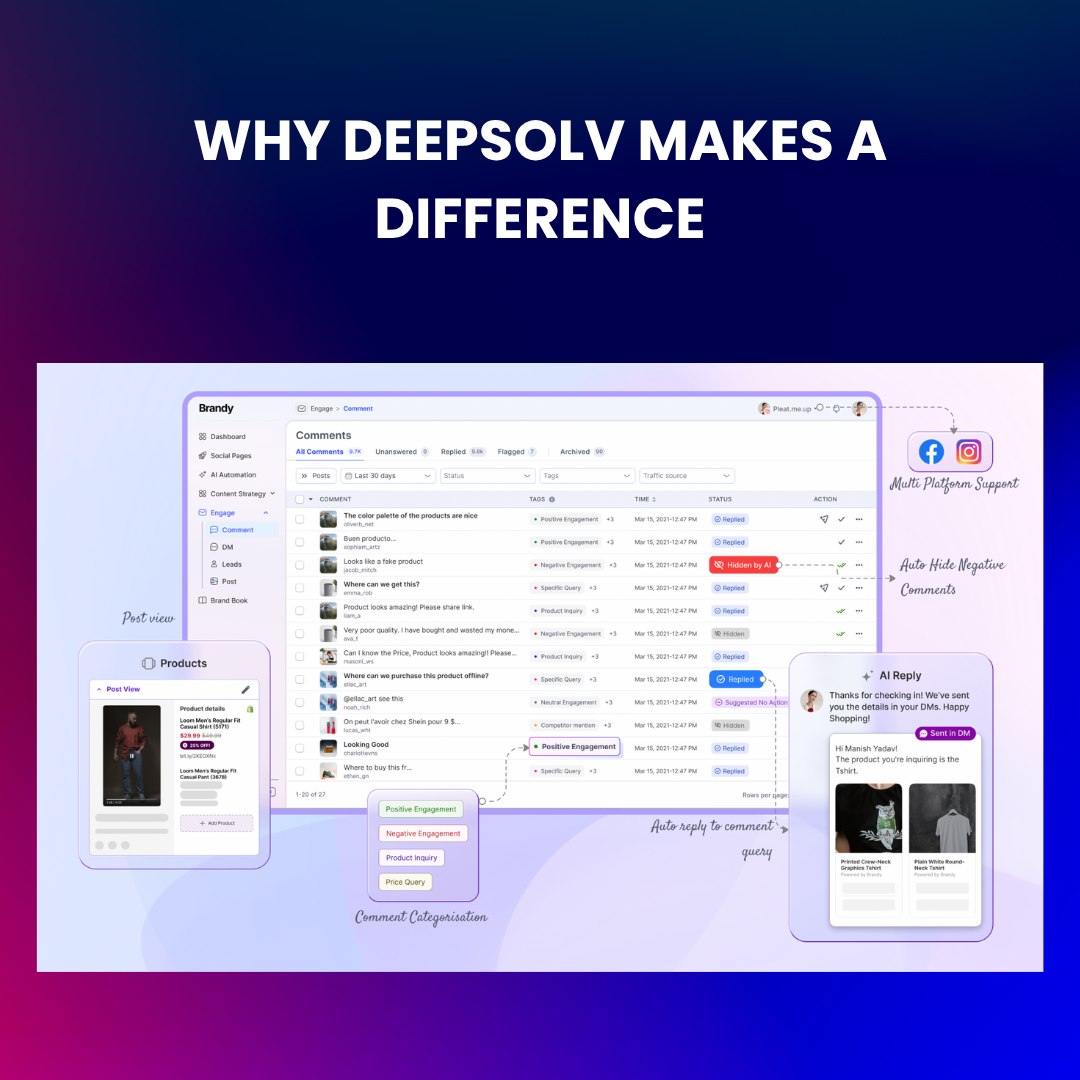
Most tools show what happened. Deepsolv helps you understand why.
What sets it apart?
- It uses AI to detect patterns in engagement, comments, and DMs.
- It flags content types that are rising in your account.
- It helps you retarget and auto-reply with human-like precision and your unique brand voice.
So while others are guessing what worked, you’ll know exactly what to post next.
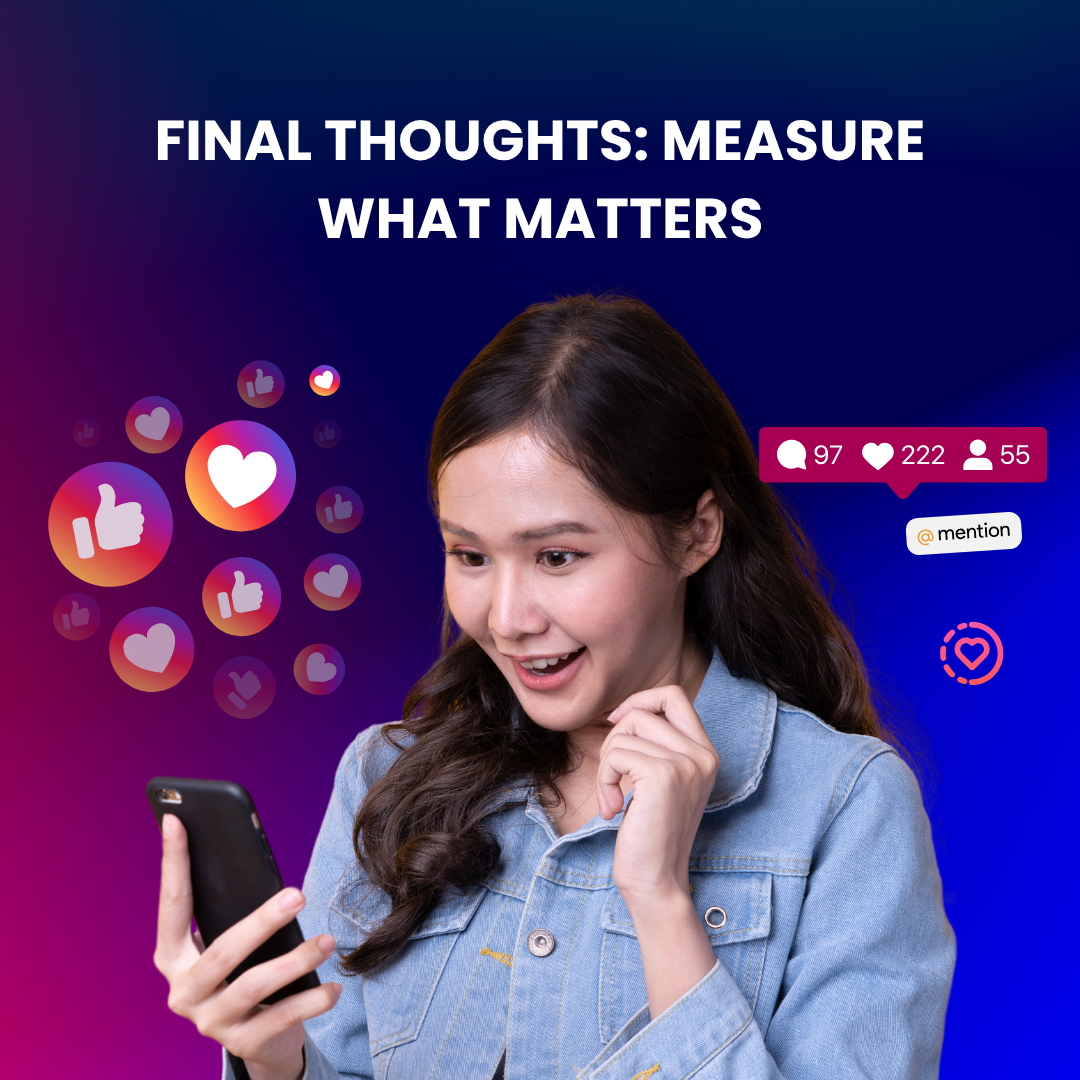
Final Thoughts: Measure What Matters
Don’t just post- analyze. Don’t just guess- act. Tools are only useful when paired with a content strategy.
And if you want Instagram performance insights that actually lead to growth (not just vanity stats), combine:
- Instagram Insights (for quick checks)
- Meta Ads Manager (for campaigns)
- Deepsolv (for smart, predictive analytics that scale with you)
It’s not about tracking everything, but about focusing on what drives your community, content, and conversions. Schedule a free call now with Deepsolv and scale your brand efficiently.
FAQs
Frequently asked questions related to this blog post